10th September 2013
Trading Strategy on Nifty / Sensex by Ashish Kyal – Zee Business & Economic Times of NBT.
Above is Trading Strategy on Nifty on Zee Business.
Following is the English transcript of article by Ashish Kyal, CMT Director of Waves Strategy Advisors published in Economic Times section of Navbharat Times.
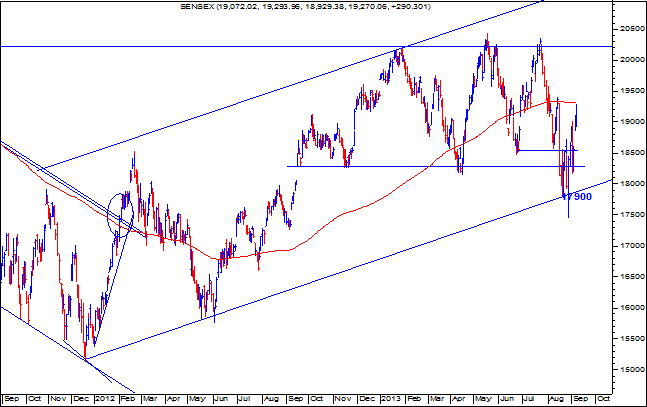
Sensex daily chart:

Sensex should cross 19560 levels to maintain upside momentum!
Indian currency movement:
India continues to stand independently in the Global markets with Indian currency the worse performing asset class among Asian peers over past month. Prices of Gold has touched life time highs in terms of INR as the currency hits life time lows i.e. USDINR made life time highs. Indian currency has exhibited one of the strongest trends over past 1 month. The depreciation in INR is not only against USD but also against other major currencies like GBP, JPY, EURO. USDINR touched near 69 levels in August end but currently we have seen some stabilization from there. We can expect this currency pair to consolidate in the range of 63 to 67 atleast for few weeks before the next move will start probably on upside.
Sensex medium term prospects:
Sensex monthly candle helps us to understand the current trend of the market. We can see that over past 3 months prices have been constantly closing below the previous months’ close, let alone close below previous high.
A very simple technique that helps to understand the trend is to see if the current bar close is below the previous bar’s high. As long as this scenario continues the trend can be assumed to be down. Strong trending moves on downside starts with formation of lower highs and lower lows. Currently we have bearish monthly bar in August and prices are failing to close above previous month’s high. The high during August is at 19560 levels. So in the current month as long as this high is not taken out and preferably on closing basis i.e. the month end close should be below 19560 our medium term outlook will be bearish. A monthly close above 19560 will result into either sideways action or an uptrend. However, 20500 is a very strong resistance which is the trendline that connects all important tops since 2008 and so we can expect range bound movement unless 20500 is taken out decisively. So medium term trend for Indian equity is down.
Bank Nifty direction:
Bank Nifty showed serious selloff in August but with onset of September we have seen strong bounce back from 8500 levels. 8200 is very important support of trendline valid since start of 2002.We can expect Bank Nifty to show some continued strength till 10300 as long as 9300 is intact on downside. Bank Nifty should show some consolidation in current week.
Short term direction: Sensex has shown good pullback from 18200 levels. Prices bounced back from the day new governor Rajaram took over from Subbarao. This means that markets have high expectations from the new RBI governor and we have to see if he can live upto the expectations. However from technical perspective 19500 will be a very important resistance and 18500 as important support. Also markets are changing direction after every 3 to 4 days of rise. Let’s see if it continues this week as well.The intraday volatility of markets has increased drastically and average movement has become around 500 points which was merely 250 few months back. During such times it is important to trade cautiously and systematically using objective techniques rather than trading on just gut feeling!

