Leaders are not falling, Catching reversal using “h” pattern
Nifty has reversed back on upside in today’s trading session which has happened after the formation of a pattern that we have coined as “h” pattern.
This pattern is coined by Waves Strategy Advisors based on the historical pattern formation on Nifty.
Now look at the below research published on 2nd September 2015 morning when majority has been highly pessimistic even when Nifty and many of the leading stocks managed to protect its low made in prior week during the crash of 24 – 25th August 2015.
Bottom Line: Nifty looks to be forming an “h” shaped pattern – a sharp fall after a sharp rise probably forming a double bottom!
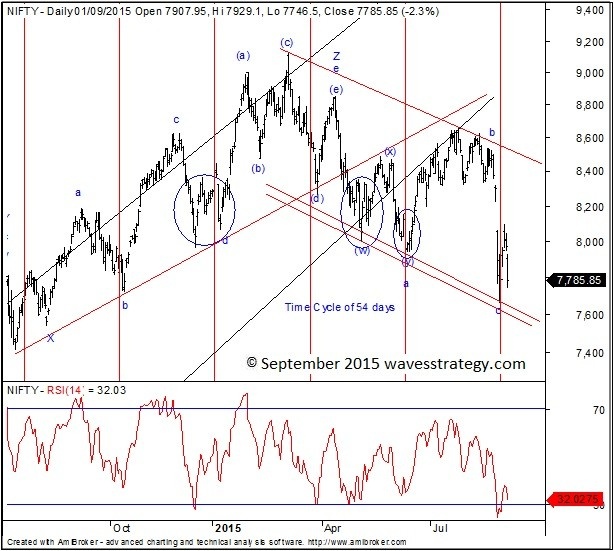
Nifty daily chart: (published on 2nd September 2015 morning)

Elliott wave analysis: (published on 2nd September 2015 morning)
In previous update we mentioned that, “expect a range bound activity to continue between 7870 and 8080 levels over short term. Break below 7870 can increase the downside pressure but the fall might get limited and protect 7667 which is previous spike low.”
Nifty had a Gap down opening of around 65 points and the index continued to trade negative throughout the day with selling pressure intensifying post 1 pm. During this downtrend many of the stocks have managed to protect the previous pivot low. One should keep a watch on market leaders that have contributed maximum to the trend. So if we look at stocks like Tatasteel, Tatamotors, Yes Bank, ADAG Group, Reliance Industries etc are still well above the lows made in previous week. So the leaders in the downtrend are now showing resilience which is suggesting that the intensity of down move on Nifty should now reduce.
What is newly coined “h” shaped pattern?
As shown on daily chart, prices are moving in downward sloping channel and prices are now near the lower end of the channel. We have come across a pattern probably no defined in text books but is found at majority of junctures in Indian markets named as “h” shaped pattern. The reason for naming it as an “h” pattern is because the structure looks very much like this alphabet. This pattern is formed when a sharp down move is suddenly interrupted by sharp up leg which does not last for more than 3 to 4 days and later prices come back to test the previous lows. The lost made in August 2013 also formed this pattern. The above daily chart shows circled areas that exhibits this “h” pattern. It creates more pessimism then the previous low even if that is not broken. Even now the pessimism is widespread even when Nifty has not broken below 7667 levels. We look at this from contrarian perspective and the leaders that resulted into capitulation in previous week are not contributing in current fall! So stay alert in case there is sharp reversal.
In short, ………….Next 1 to 2 days are crucial and will indicate if our reading of “h” pattern is correct!
Here we are today when Nifty is up by more than 110 points and prices indeed form the pattern as expected… We have been strongly bearish during last week of August and markets obliged by falling a whopping 500 points in single day on Monday of last week.
Now the pessimism is widespread but we expected a bounce based on Channels, Pattern recognition, Elliott wave and Time cycles.
You can be a part of this objective way of trading and understanding the market movements. Do not get carried away with the news or events. We are at very interesting times with a good trending and trading opportunities which is not very often. Subscribe “The Financial Waves short term update” and get insights into all the techniques with detailed charts on daily basis. For subscription visit Pricing Page or Contact US for more details.

