Here’s how to use Diametric pattern Combined with Fibonacci Retracement for a Profitable trade
In a consolidating market it is very difficult to rely on standard technical patterns as most tend to give a false breakout.
In some cases it is difficult to even identify the ongoing corrective pattern using Elliott waves. In such scenarios Neo wave comes to the rescue as almost every possible price action can be mapped to Neo wave pattern.
Manapparum is one such case where we used the diametric pattern of Neo wave to predict the next move in the stock and it precisely moved as we expected.
Below is the chart showing detail analysis using Elliott Wave and Fibonacci retracement to project its up move:
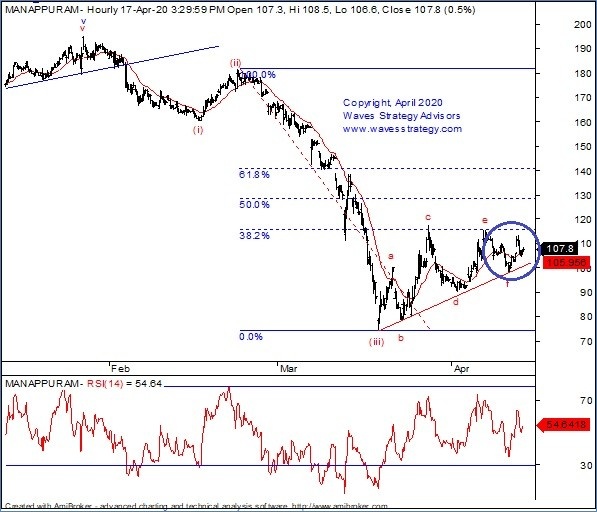
Manappuram 60 mins chart: (Anticipated on 20th April 2020)

Here’s how to use Diametric pattern Combined with Fibonacci Retracement for a Profitable trade
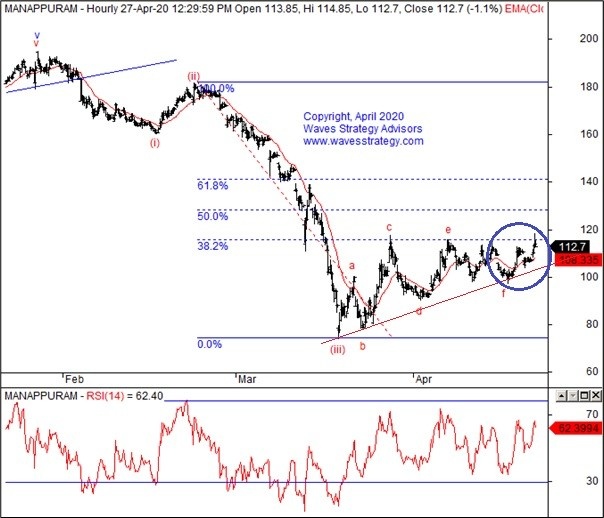
Manappuram 60 mins chart: (Happened as of now)

Here’s how to use Diametric pattern Combined with Fibonacci Retracement for a Profitable trade
(Below is the gist of analysis taken from daily equity report published on 20TH April 2020)
Wave analysis:
As per wave perspective, currently first leg of correction is in the form of wave a (blue). The internal counts suggests that currently we seem to be moving in wave (iv) which is forming as Diametric pattern as prices moving in overlapping manner the same you can see on hourly chart.
As shown on the hourly chart, we have shown Fibonacci retracement of wave (iii) which suggests that prices can retrace up to 38.2% near 115 levels and if it break above the same then we can see up move to continue towards 50% retracement of down fall. Currently the last leg of diametric pattern is unfolding in the form of wave g.
In short, Manappuram looks to sideways with bullish. Move towards 115 or higher levels can be expected as long as 100 levels stay intact on lower side which is near the hourly channel support.
Happened: Prices moved just in line with our expectation retracing more than 38.2% of wave (iii) made an intraday high near 117.80 levels.
The above analysis clearly shows how well Elliott and Neo wave patterns work when clubbed with advanced techniques like Fibonacci retracement or extension for predicting the further move.
Get access to the daily equity research report & capture such amazing trading opportunity over short term “The Financial Waves short term update”–Get access here
You can subscribe to our Intraday calls advisory and get free daily equity research report along with it. See the details here
Learn the concepts of Channeling technique, Fibonacci series along with Elliott and Neo wave with practical charts, indicators and much more which can provide good trade setup in this volatile market Enroll for Mentorship June 2020 batch under Early Bird offer ending on 10th May 2020 . Know more here

