What is difference between Elliott wave and Neo wave? Application on Nifty charts!
Neo wave is an Advanced Elliott wave method with more number of rules and newer patterns to increase the overall objectivity.
Orthodox Elliott wave was originally discovered by R. N. Elliott in 1930s. His original work mentioned that stock market does not move randomly but in systematic fashion that follows Fibonacci numbers and natural laws. This systematic movement in prices are in form of waves. Normally there are 5 steps forward and 3 steps backward resulting into a net progression which is valid for stock market as well. The concept cannot be just applied but one needs to understand the basic premise and certain rules to apply it objectively.
Any price movement as per basic Elliott wave is classified into Impulsive and Corrective. There are various patterns within these broader heads. Impulsive waves need to follow three basic rules:
- Wave 2 cannot retrace complete of wave 1
- Wave 3 cannot be the shortest of the directional waves 1, 3 and 5
- Wave 4 cannot enter into territory of wave 1
The above 3 basic rules if followed then the price movement under consideration can be classified as a normal Impulse wave.
However, when the market structure is complex there is possibility that the movement can be counted in many different ways. This can result into subjectivity and the entire purpose of wave theory can be lost. To overcome this limitation Neo wave was developed that has more than 15 different rules to define a simple impulse pattern. Following are a few of them:
- Wave 2 cannot retrace more than 61.8% of wave 1
- Wave 3 cannot be the shortest of the directional waves 1,3 and 5
- Wave 4 cannot enter into territory of wave 2
- There has to be atleast one extended wave which is going to be 1.618% of non extended wave. If there is no extension then the pattern under consideration is corrective
- One of the directional waves should subdivide
- Corrective waves should consume more time than the preceding impulsive wave
- Touch point rule: Out of 6 points not more than 4 points should lie on the channel
- …
- …etc
The above shows only a few set of rules for an impulse pattern as defined by Neo wave to all the rules more in detail attend Masters of Waves Online training happening on 04th - 05th September 2021.
– Diametric Pattern
– Neutral Triangle
– Extracting Triangle
– 3rd Extended Terminal with 5th Failure
These new patterns are equally important to understand because majority of the movement seen in the world equity markets are taking the forms of these patterns that were never covered in original work of R. N. Elliott
We take a step ahead and combine this complex study of Neo wave to that of Time cycles. It is not always that both the studies will be in sync but when they are indeed suggesting the same outcome that is the time that the trade setup is of very high accuracy and it just leaves only one probable outcome. These are the times when one can go all in with prudent risk and money management strategies which have the potential to give the best of the returns in shortest amount of time.
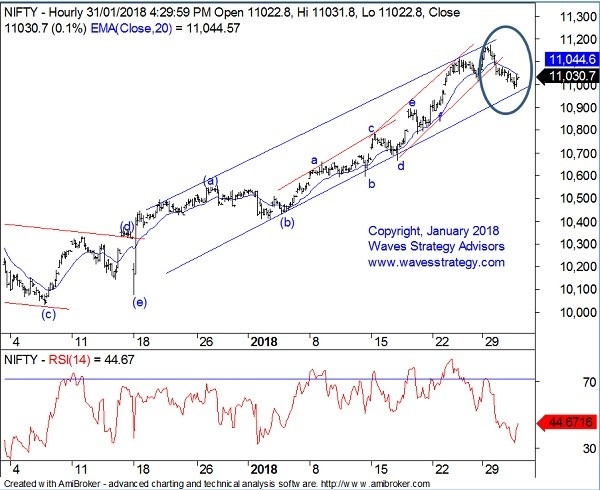
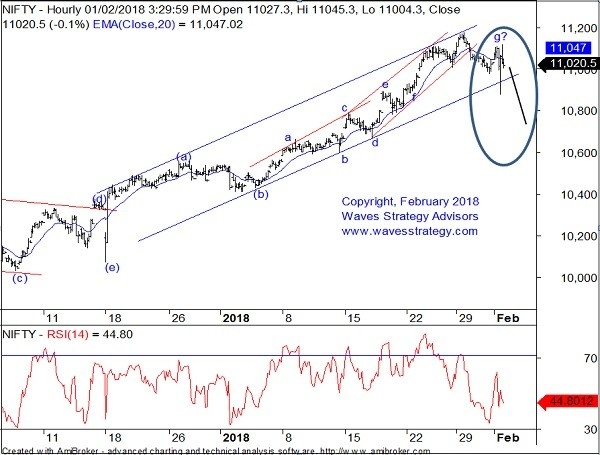
Below part of research was shown 01st February 2018 daily research report when Nifty was in the toping zone that too on the Budget day!
Nifty 60 mins chart – Anticipated on 1st February 2018

Nifty 60 mins chart – Happened & Anticipated on 2nd February 2018

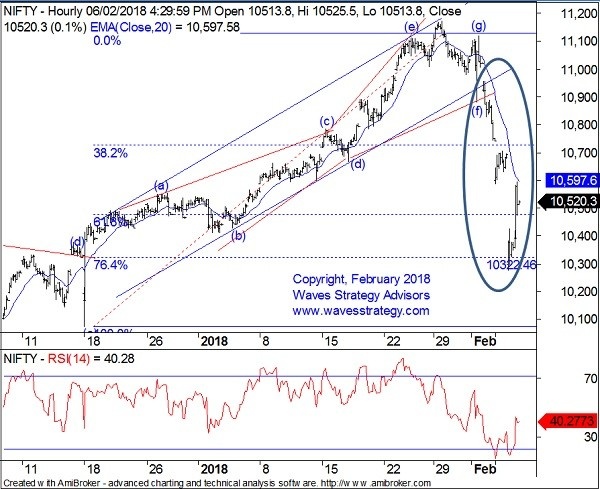
Happened as on 6th February 2018:
Nifty 60 mins chart:

The above charts are self-explanatory and simply show power of Neo wave.
Following was mentioned on Budget day before markets opened on 1st February 2018
“It is best to trade systematically with 10920 as very important support and 11170 as important resistance. As the fall of past two days is overlapping without any momentum we might see positivity or atleast a retest of 11120 levels.” BANG ON!
Happened: Nifty touched high of 11117 before reversing for the month
On 2nd February morning research we mentioned that – it seemed to be a populist Budget like everyone expected but introduction of Capital gains is going to result an impact which is not yet discounted maybe due to artificial support. Trade carefully as the swings can still be big over next few days! Move above 11120 is must to resume the positive trend else break below 10878 will be strongly bearish!
Happened: Low at 10878 was broken and everyone knows the serious selloff resulted into price moving towards 10276 levels in less than a week.
The above clearly shows how understanding Neo wave pattern helped us to catch a top when majority were busy buying exactly at the wrong levels and wrong time. The fall also happened precisely towards the level of 76.4% retracement of the rise which was shown on the daily research report.
References are taken from “The Financial Waves short term update” daily research report which covers Nifty, Bank Nifty and stocks on rotational basis and “The Financial Waves Monthly update” that shows medium to long term perspective on Nifty, INR Pairs, Global Markets, Gold, other commodities. For subscription options visit Pricing Page
See What is the difference between Elliott Wave and Neo Wave? by Ashish Kyal over here
Attend the most Advanced Technical analysis training on Application of Neo wave and Time cycles with practical charts on different time frames for intraday to positional trading and investments dated on 04th and 05th September 2021. This training will focus on the above methods along with lot of other studies which can be combined together to produce very high conviction trade setups. Register NOW – For more details Contact US or write to us at [email protected] or call us at +91 22 28831358 / +91 9920422202

