4th September 2014
BSE Forum: Change in dynamics of Indian Markets by Ashish Kyal
Change in Dynamics of Indian markets post September 2013!

Below article was published in BSE Forum Magazine in their September Issue
The rally was initially attributed to the election expectations and is now in expectations that the growth should be back on track eventually with reduction in inflationary pressure.
From Investment perspective it is necessary to look at charts that help in analyzing the direction of trend.
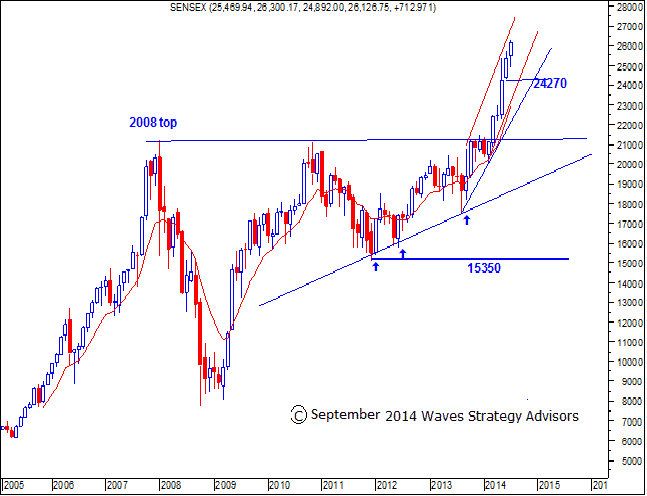
Figure 1:Sensex Monthly chart

Indian equity markets showed strong outperformance against Global markets since August 2013. Indian markets continued its movement in the unchartered territory and Sensex crossed 26000 mark in July. The index continued to trade at new highs in June and formed another strong blue candle.
Figure 1 clearly shows 6 consecutive blue candlestick formations and all the bars have managed to close above the previous month’s low as well. As long as the monthly low remains intact the medium term trend as per bar technique will remain positive. An investor can use this simple concept of bar technique to stay in the trend as long as it continues. Looking at the candle at the end of the month and if the monthly bar manages to protect the lows of previous bar the trend will continue to be positive.
10 days Exponential Moving average: Another way to ride the trend is to use trend following method. As per this technique the uptrend will continue as long as prices stay above 10 period Exponential Moving average. This average has been very well respected so far. The current reading of this average is near 23000 level as shown on the chart.
Prices are now in 6th consecutive positive month. Using trend following system is best trading strategy rather to catch a top.
Sensex in terms of real money – GOLD!
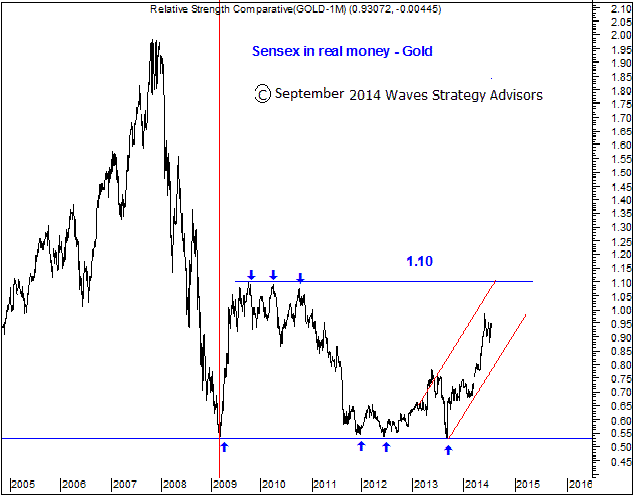
Sensex in terms of INR does not represent how Indian markets have fared in terms of real money. Currency is printed by the country’s central bank, which is backed by bonds and other debt instruments and might not necessarily represent the correct value. It therefore becomes necessary to see how stock market has been doing in terms of real money which isGOLD.Sensex in terms of Gold shown below needs little explanation.
Figure 2:Sensex in GOLD daily chart

The above chart clearly represents that Indian markets topped out in November 2007 itself whereas the actual index shows a topping action in January 2008. Since then Sensex in Gold has been way below its life time highs and so are majority of the stocks. Even when actual Sensex recently touched new highs but many stocks have still not taken out their previous highs. Many of you might agree with me that both Sensex and Nifty in terms of INR are not representing true picture of what has happened with broader market. But if you see the chart of Sensex in Gold you can see the real movement of Indian markets. On upside the Sensex / Gold ratio is having the resistance at 1.10 and currently it is trading at 0.95. So, Indian equity markets should continue its outperformance for few more months. This ratio chart also shows that Equity markets are currently preferred for investments over Gold as the ratio is moving higher.
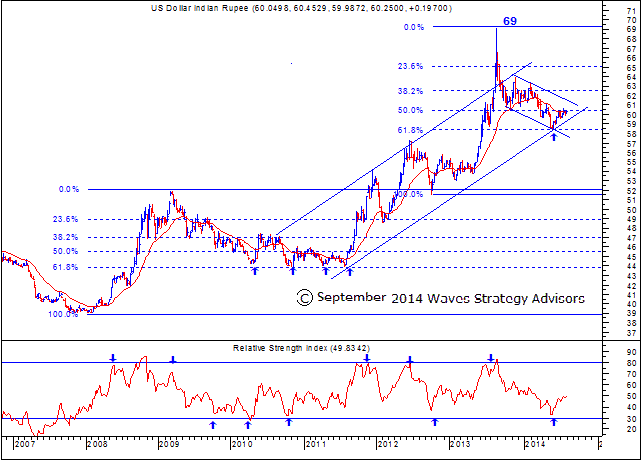
Figure 3: USDINR Weekly chart spot

Indian currency has been trading relatively stable this year compared to euphoric and highly volatile movement in 2013. High volatility in currency can wipe out the profit margins of companies havingForex exposure. It is therefore important for central bank to take prudent steps in order to curb high volatility!
As shown in weekly chart, USDINR bounced from the crucial support zone of 58 in month of May 2014 which is the important channel support along with 61.8% retracement of the entire up move from 51.20 levels to the highs of near 69. The level of 51.20 was seen in October 2012 and this pair touched nearly 69 in August 2013. Indian currency along with many Asian currencies was then looked upon as near crisis similar to that seen in 1997. However, many were surprised on dramatic reversal from 69 but after the new RBI governor Mr. Rajan took over as RBI governor in September 2013 he has tweaked the policies in right direction to curb the volatility in the Indian currency pair.
The importance of 61.8% Fibonacci retracement: in the year of 2009 prices made a high at 52 and then corrected towards 44 levels by mid 2011. This downside correction exactly took support at 61.8% retracement of the prior up move from 39 to 52. After that we can see that USDINR started multiyear uptrend. The point here is to show the importance of 61.8% Fibonacci retracement. Even this time prices have respected 61.8% Fibonacci retracement level very well. USDINR bounced back from 58 levels in the month of May 2014 and moved higher till 60.50 levels. So, over short to medium term price action near 58 becomes very crucial.
RSI indication: in the entire uptrend that started from 39 to 69, RSI has moved very well in between 30 and 80 levels. We can see that whenever RSI arrived near 30 levels, it gave respect to the same and reversed on upside. Even recently when prices were trading near 58 levels, RSI was moving at 30 levels and we got to see the up move of almost 2.00 whole points from the lower levels.
In short, 58 and 61.50 is the range for USDINR. A strong break above 62 can be a concern both for Import oriented companies and for RBI since as this psychological level of 62 is broken there can be again rush for buying of dollars to safeguard against sharp depreciation!
Brief Profile:
Ashish H. Kyal is the Founder of Waves Strategy Advisors Pvt. Ltd (www.wavesstrategy.com) He is a Chartered Market Technician (CMT). Ashish is an MBA and did his Bachelor of Engineering from Mumbai University. He is a member of Market Technicians Association (USA). He has vast experience in Capital markets and has worked with leading Investment Banks like Lehman Brothers, Nomura Holdings within Capital Markets division.
Ashish is a frequent speaker on business channels like CNBC TV 18, Zee Business. He is a regular columnist for Economic Times section of Navbharat Times, a leading newspaper in India. He has also been a guest speaker at host of management colleges & frequently speaks at financial seminars likeNational Institute of Bank Management (NIBM), Market Technicians Association (USA), etc.
Waves Strategy Advisors offer various services across Equity, Commodity, Global and Forex segment. Daily research report, Intraday/ Positional advisory, Long term forecast on Global Markets an Training on Advanced Technical Analysis concepts like Elliott Wave, Time Cycles

