TDPOWERSYS – Price Action along with Technical Indicator
May 16, 2022
Like this Article? Share it with your friends!
Trading breakouts can be tricky sometimes and it's best to use additional confirmation of other indicators to identify strong breakouts. Check out how we recently identified one such breakout in TDPOWERSYS
Stocks like TDPOWERSYS moved very well if one were to use simple patterns and Exponential Moving Average (EMA).
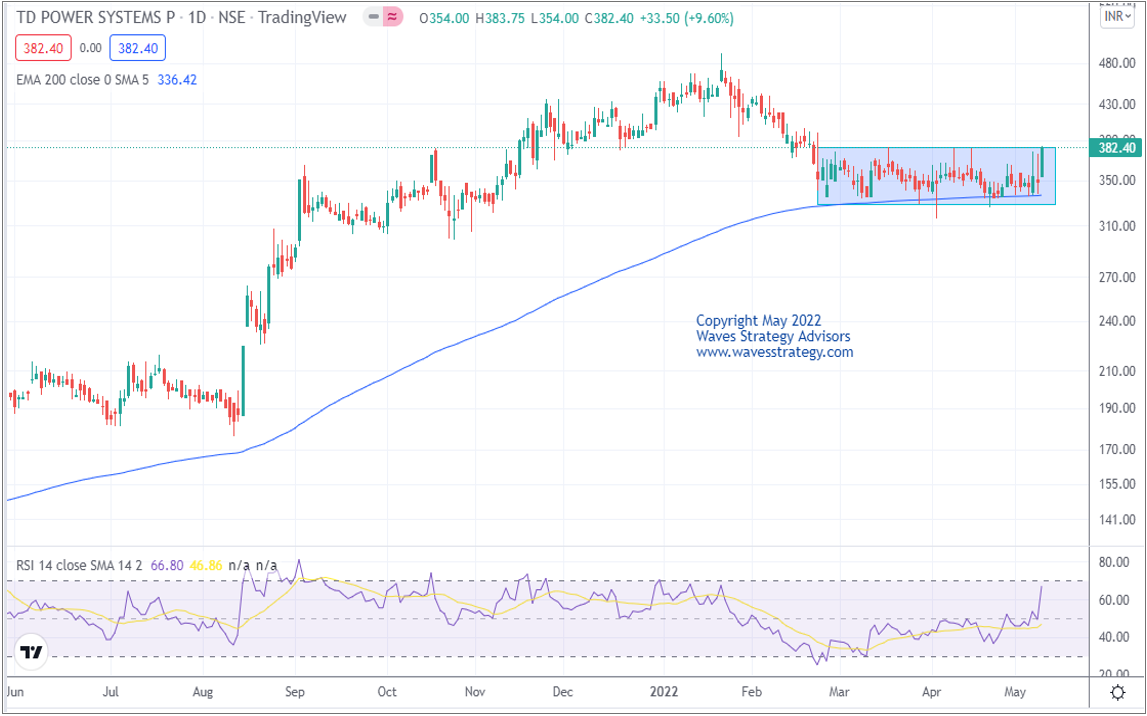
We published the following article on TDPOWERSYS pre-market on 12th May 2022 in "The Financial Waves Short Term Update" which our subscribers receive pre-market every day.
TDPOWERSYS as on 12TH MAY 2022 (Anticipated)

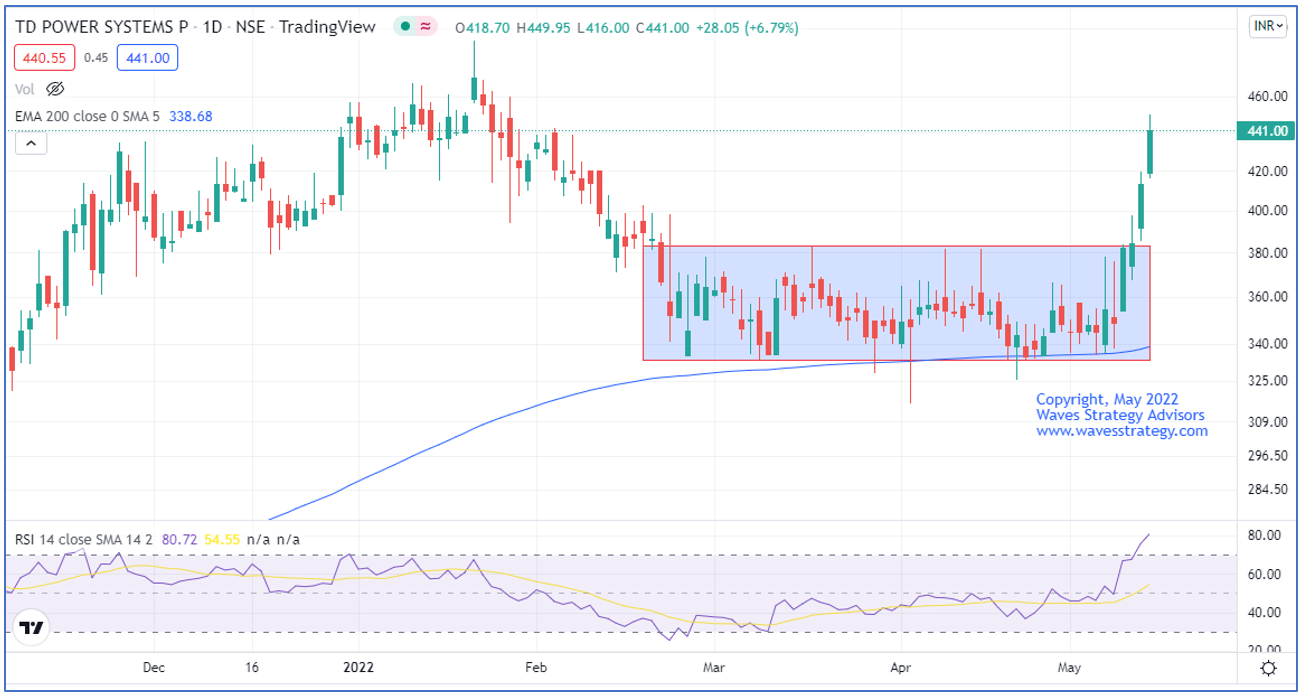
TDPOWERSYS as on 16th MAY 2022 (Happened)

Wave analysis as on 12th May 2022
On the daily chart, in the previous session prices formed a bullish candle. Price has been moving in a rectangular range over the last few days indicating accumulation in the stock. In the previous session prices have managed to close above this trading range which has resulted in a bullish breakout of the rectangular pattern. 200-day period Exponential Moving Average is acting as a brilliant support line and it has provided support at regular intervals. This suggests that one should be in the direction of the ongoing trend as far as this line is protected.
In short, trend for this stock is positive. A break above 385 can lift the price higher towards 415-420 as long as 364 holds on the downside.
Happened:
Stock has opened gap up and moved towards higher levels as we expected. As we can see that after the breakout of consolidation, prices continued to move higher and made high of 447 which is nearly 16% up from above mentioned level within 3 trading sessions.
Summer Offer - Subscribe to the Equity, Nifty, Bank Nifty calls at a discounted price and also receive free research report on Equity that will show path ahead from here on. Trade objectively and be thrilled to see much before how the markets can move rather than relying on news or events to take trading decisions. Know more here
Master of Waves – MOW Season 3 Trade the patterns that has capability to forecast the future as that will give an edge rather than relying on events or news which are lagging. Neo wave is powerful technique which along with 55 Days time cycle can provide much needed clarity to traders. Only Limited seats, Are you part of this Elite Trading community, Fill out the form below for more details
