How to use Price Patterns with Indicators to find unidirectional moves
Sep 06, 2021
Like this Article? Share it with your friends!
Simple strategies like price patterns can be combined with certain indicators to achieve powerful results. Check out how we selected SOBHA which has rallied more than 20% within 4 days
We published the following research on SOBHA pre market on 02nd SEPTEMBER 2021 in "The Financial Waves Short Term Update" which our subscribers receive pre-market every day.
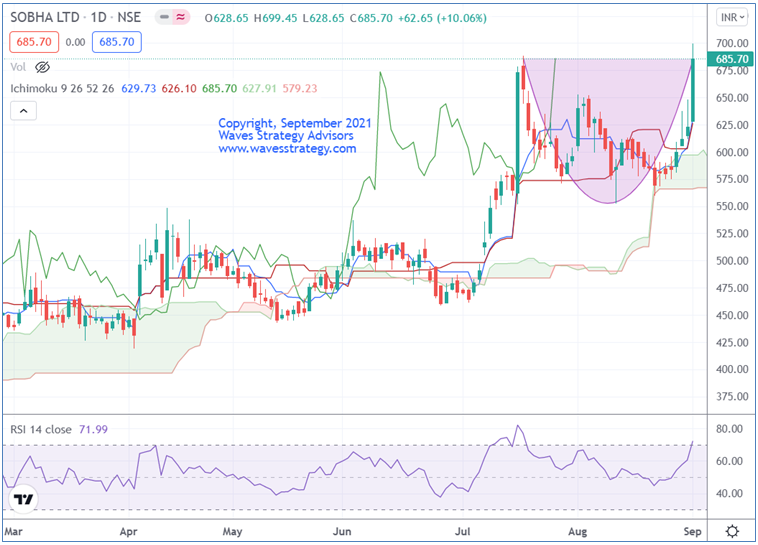
SOBHA Daily chart as on 02nd SEPTEMBER 2021 (Anticipated)

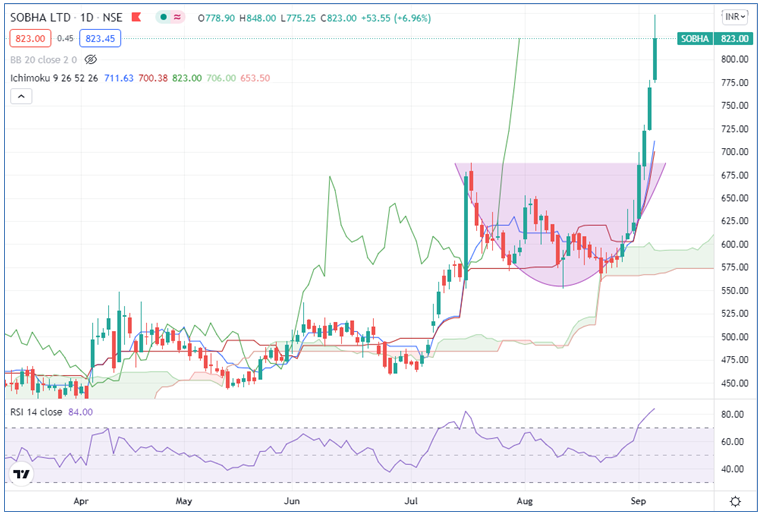
SOBHA Daily Chart as on 06th September 2021 (Happened)

Analysis:
Sobha has been moving higher recently and intact in strong uptrend. In the previous session it closed with a massive gain of 20%.
On the daily chart, in the previous session the stock formed a strong bullish candle. We can see rounding bottom pattern has formed. Prices have given close above 685 which confirms breakout of rounding bottom pattern. Price is trading above Ichimoku cloud which indicates that short term trend is bullish.
In short, the trend for this stock is positive. Use dips towards 675-670 as buying opportunity for a move towards 740-745 levels as long as 650 holds on the downside.
HAPPENED: SOBHA has touched its new lifetime high near 848 levels on 06th SEPTEMBER 2021. The stock has given a return of more than 20% within a short span after we covered it in our research report.
Subscribe to “The Financial Waves Short Term Update” equity research which covers Nifty, Bank Nifty, Stocks detailed Elliott wave outlook. Get access here
Mentorship on Technical Analysis to Become a Finest Trader – It takes steps to change the habits or compulsive behaviour to start trading successfully. A disciplined approach and a systematic plan, a clear Goal is a must. In this Mentorship program, all the necessary tools are given right from stock selection methods, strategy, follow-up action to derive a complete trade setup in step by step fashion. To know more check here
