2 Powerful Indicators for Successful Breakouts.
Nov 11, 2021
Like this Article? Share it with your friends!
We used these 2 indicators on RSWM and were able to capture a 8.8% move in a short span. You can also use these to identify stocks with momentum for short term trades.
We published RSWM analysis in "The Financial Waves Short Term Update" on 02nd November which our subscribers receive pre-market every day. Check out below the detailed research report that we published.
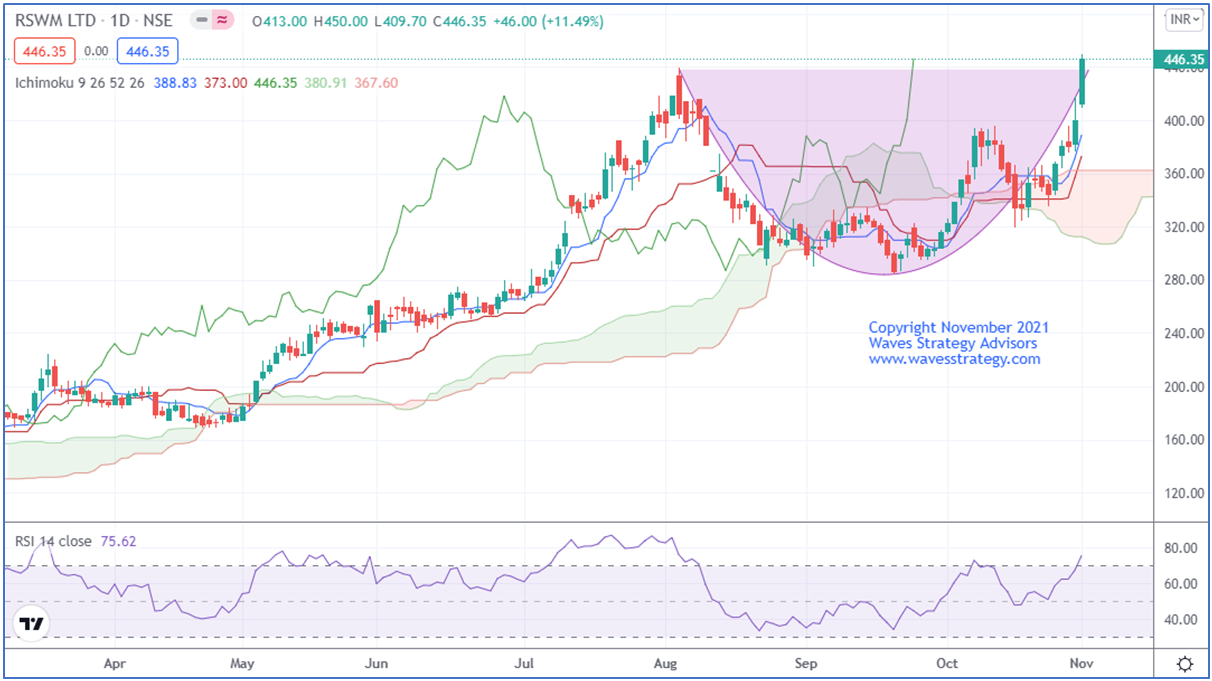
RSWM daily chart as on 02 November 2021 (Anticipated)

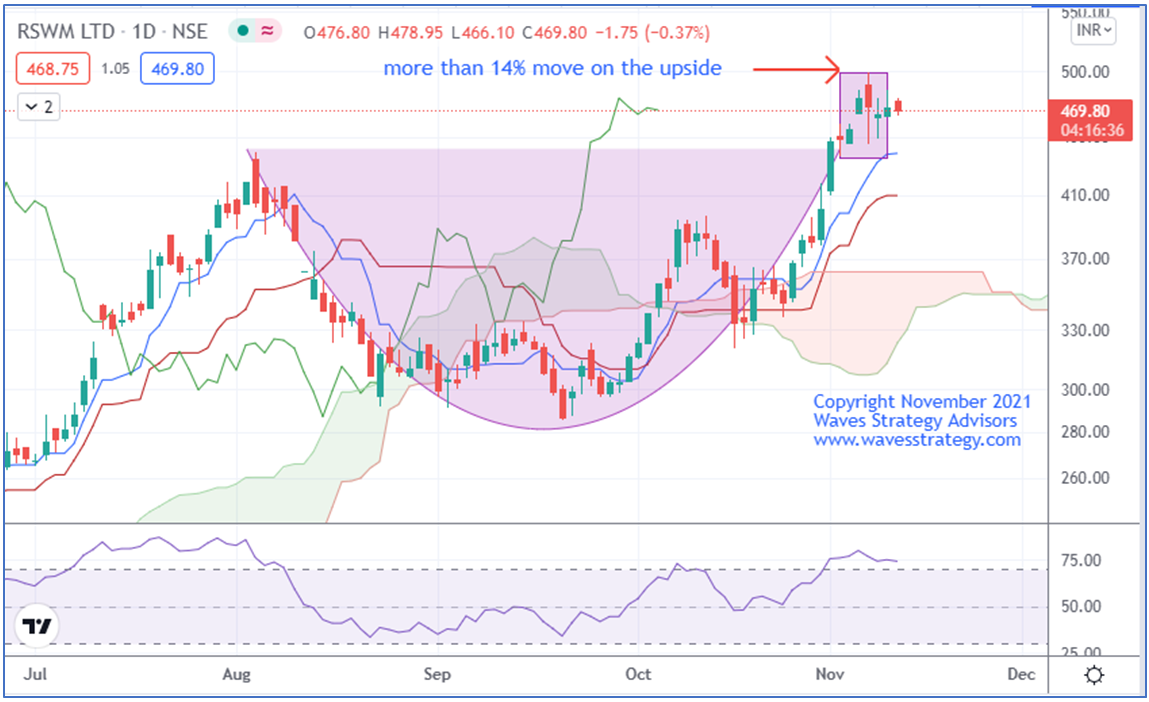
RSWM daily chart as on 11 November 2021 (Happened)

Wave analysis:
On the daily chart, in the previous session, the stock formed a bullish candle. We can see rounding bottom pattern has formed. Price has closed above 440 which confirms the breakout of rounding bottom pattern. Price is trading above the Ichimoku cloud which indicates that the short term bias is bullish.
In short, the trend for this stock is positive. Use dips towards 432-435 as buying opportunity for a move towards 470-475 levels as long as 415 holds on the downside.
Happened: After we published the report the stock made a high of 499 levels exceeding our target of 475! Giving more than 9% move in a short span.
Subscribe to the Daily equity research report – The Financial Waves Short Term Update and get insight into Nifty, Bank Nifty, Stocks that are providing good opportunity and much more. Get access now to be on the right side of the trend over here
Did you check my today's video on Smallcap Stock Comfort Fincap Time Cycles with Volume Profile check here
3 Months of Mentorship on Timing the Markets – Time the market using Simple, Easy and Effective Time cycle trading techniques with a combination of Step by step methods using Candlesticks, Timing tools, and Elliott waves, complete handholding, stock selection methods, Algo creation, Options trading with a complete Trade plan, to know more contact us on +919920422202 or fill the below form
