How to use Price Action with Indicators for analysing stocks
Jan 27, 2022
Like this Article? Share it with your friends!
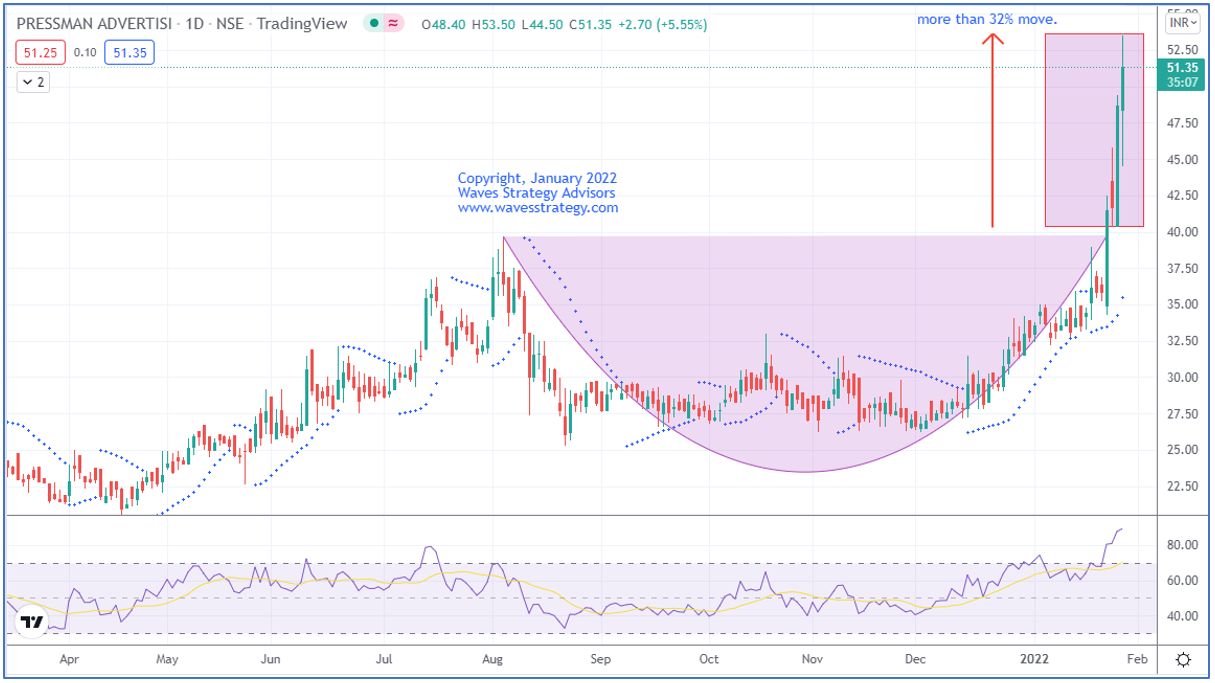
It is possible to capture massive moves in stocks using price patterns and simple indicators like the parabolic SAR. Check out how we selected PRESSMN which has rallied more than 32% within 2 trading sessions.
We published the following research on PRESSMN pre-market on 24th January 2022 in "The Financial Waves Short Term Update” which our subscribers receive pre-market every day.
PRESSMN Daily chart as on 24th January 2022 (Anticipated)

PRESSMN Daily chart as on 27th January 2022 (Happened)

Wave analysis as published on 24th January 2022
Anticipated - On the daily chart, in the previous session prices formed a bullish candle pattern. We can see rounding bottom pattern has formed. Price has closed above 39.6 which confirms the breakout of the rounding bottom pattern. We have applied parabolic SAR which is used to determine the price direction as well as draw attention to when the price direction is changing. A series of dots placed below the price which is deemed to be a bullish signal.
In short, trend for this stock is positive. Use dips towards 40.3-40.7 as buying opportunity for a move towards 47-47.5 levels as long as 39.3 holds on the downside.
Happened - Stock moved precisely as we expected. It dipped towards the level of 40.3 which we have mentioned as buying opportunity and within next the 2 trading sessions, the stock rallied more than 32%.
Are you riding the trend with our Freeweek Equity research report - Ending tomorrow.. Access now
Be a part of upcoming Mentorship on Timing the Markets starting in March 2022 and learn the science and essence of Time. We combine the above cycle with smaller cycles to time it to the very Hour and Minute. Mentees will get access to the Master of Cycles program along with Option Trading Using Technical analysis (OTTA) and Master of Waves (MOW), Fill the form below to Know more or WhatsApp on +919920422202
