How PARADEEP Achieved a 12% Rally - Price Patterns & ADX Insights.
Apr 24, 2025
When combining basic price patterns with technical indicators like ADX, it can lead to remarkable results in trading. See how we captured a significant move in Paradeep Phosphates Ltd stock by applying the ADX momentum strategy. Check out how the stock rallied by more than 12% after our prediction.
We published the following research on Paradeep Phosphates Ltd on 16th April 2025 in the “Vayu Momentum Report” which our subscribers receive pre-market every day.
Paradeep Daily Chart: Anticipated as on 16th April 2025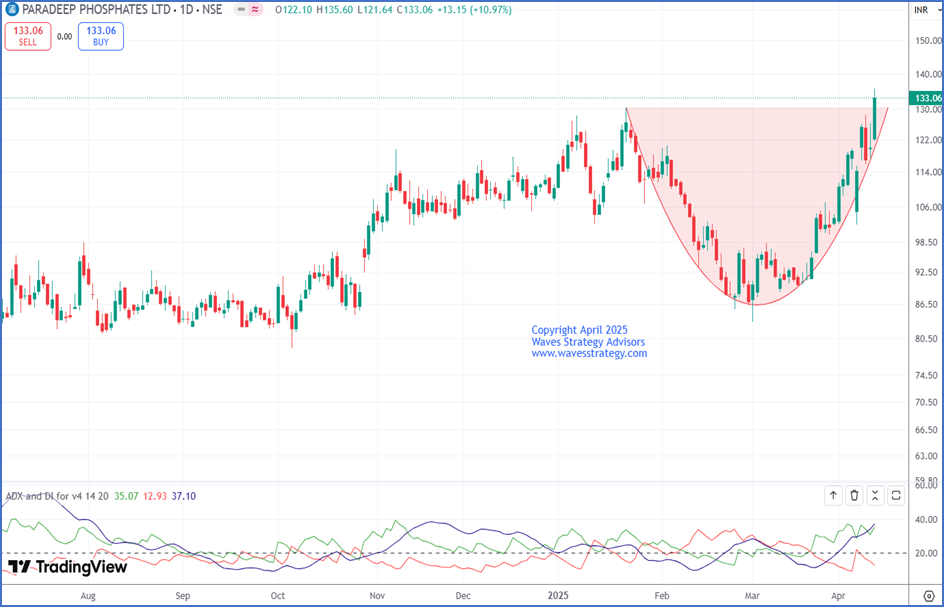 Wave Analysis as on 16th April 2025:
In the previous session, PARADEEP finally closed above minor 3 days of consolidation and surged by 10.97%.
The stock was witnessing a rounding bottom formation since January 2025 on the daily timeframe. In the previous session, prices finally gave a breakout of it as it managed to close above neckline of 130.50 levels which confirms the breakout of the pattern. Along with this, ADX helps to understand the overall momentum of the stock and now is showing readings of 37 levels suggesting good momentum is likely to continue. However, currently looking at the sharp rise in the previous session buy on dips looks to be a prudent strategy to ride the trend better.
In nutshell, trend for PARADEEP is bullish. Use dips towards 130-132 as a buying opportunity for a move towards 143 levels as long as 128 holds on the downside.
Key Resistance: 143
Key Support: 128
Strategy: Use dips towards 130-132 as a buying opportunity with the targets of 140 followed by 143 with the stoploss of 128 levels.
Paradeep Daily Chart: Happened as on 24th April 2025.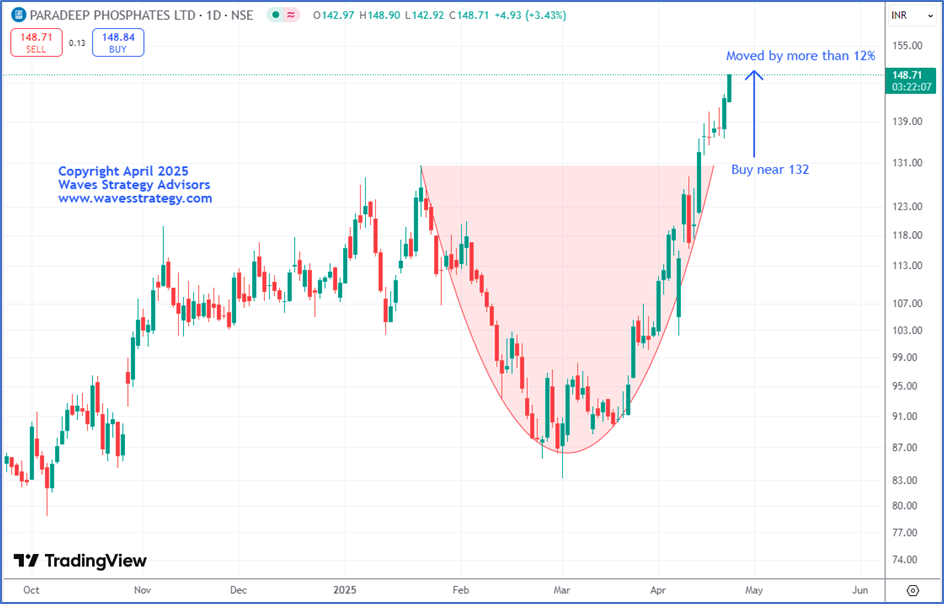 Happened- After we published our report, the stock moved in sync with our expectations. Paradeep have rallied more than 12% in a short span of time and BANG ON!! Prices not only managed to achieve both our given targets but also is continuing to make new fresh highs and is currently trading at 149 levels. We successfully captured this entire rise by simple price action and ADX.
It is fascinating to see how accurately combining basic indicators like ADX with price action can help predict targets with accuracy.
Want to know more about such stocks on the mark! subscribe to our Vayu Short-Term Update: Get a list of stocks with high growth potential: Check Here
Brahmastra (Mentorship) on Trading - Learn the science of forecasting using Time and Elliott wave, Neo wave, along with risk money management, stock selection algo, Options trading with a complete plan. Limited seats only, Next batch starts in April 2025. Fill below form for more details