Nifty Diametric Pattern on Hourly with Ichimoku Cloud
Nov 12, 2021
Like this Article? Share it with your friends!
Using wave theory and other indicators like Ichimoku clouds we can predict price moves in Nifty with high accuracy.
We published Nifty analysis in "The Financial Waves Short Term Update" on 11th November which our subscribers receive pre-market every day. Check out below the detailed research report that we published.
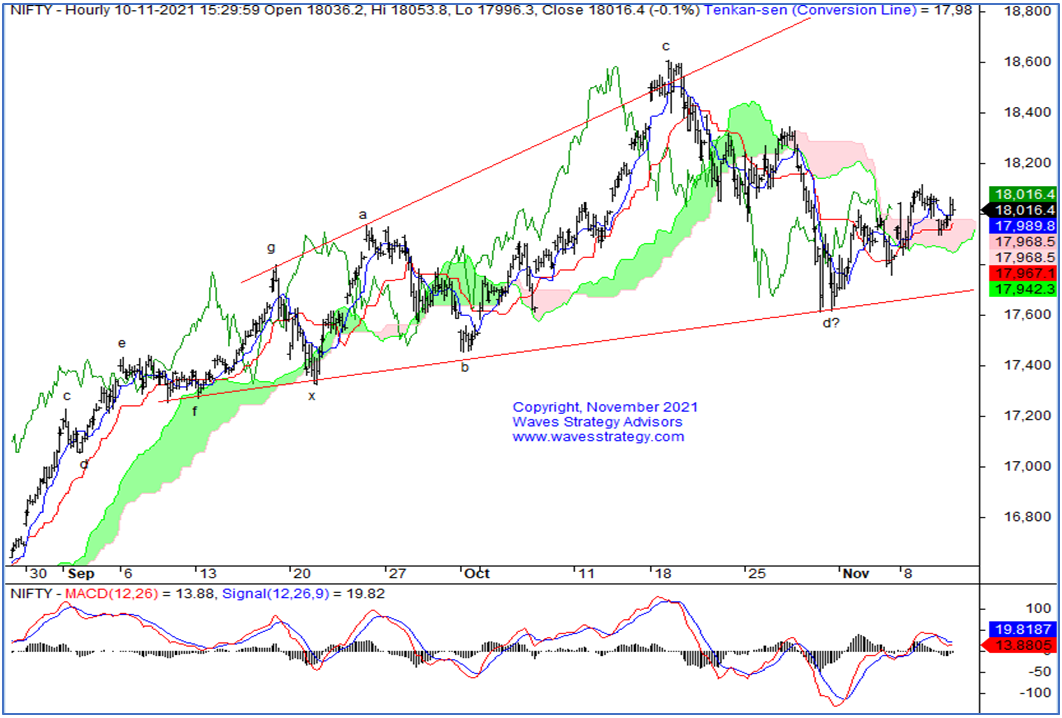
Nifty 60 mins chart (11TH November pre-market):

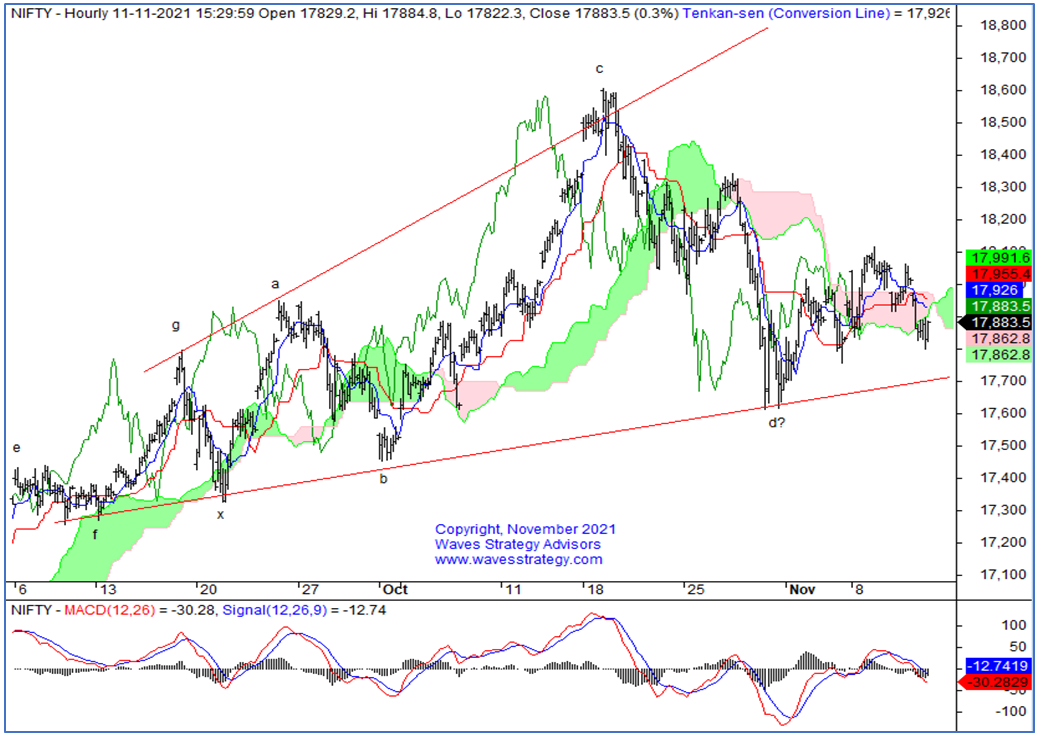
Nifty 60 mins chart (11TH November post-market):

Wave analysis:
In the last update, we mentioned that “Nifty did take out 18000 mark however strong momentum is still missing. Daily close above 18100 will continue the journey towards 18200-18230 levels with 18350 as major hurdle whereas any move below 17836 will provide the first sign of weakness.”
In the previous trading session, Nifty had a Gap down opening at the 17973 level and moved lower till 17915 levels in the first hour of the session. However, post that it failed to generate strong momentum on the downside and reversed on the upside sharply towards the 18061 level during the day. This price action has filled the entire gap down area and closed on the minor negative note with 27 points loss. In yesterday’s session, for Nifty50, 22 advances were witnessed against 27 declines. The price action of the last few days suggests that it has continued to hover around the 18000 mark and a strong trending direction is awaited now.
Sector wise, mixed action was witnessed across the board wherein a flattish move was observed in the last session. Smallcap50 and Midcap50 saw profit booking and closed on a minor negative note whereas Bank Nifty lost around -0.88% and arrived close to the 39000 mark. For Bank Nifty, it will be important to see where breakout takes place.
On the daily chart of Nifty, narrow range price action continued for the second consecutive day which led to the formation of a small bullish candlestick pattern. However, from a bar perspective, it has given close below prior bars low which has turned daily bias on the downside. Nevertheless, the formation of the decisive candlestick is still awaited on either side. At the same time, prices have been still trading below middle Bollinger bands which have started to act as resistance now as per polarity reversal. We need a strong close above middle bands which is placed at 18088 levels. Failure to close above the same in the next few days will hint towards weakness that might be building up. On the lower side, violation of spike low of 17836 made of 8th November will confirm bearishness.
As shown in 60 mins chart, post the low formed at 17613 level, higher high higher low is still intact. Even in the previous session prices filled the Gap down area which suggests we might witness some more upside if the highs of 18115 is taken out with strong momentum. As per wave perspective, we will continue to give preference to wave e of Neutral triangle pattern looking at the overlapping rise from the lows of 17613 levels. One should continue to trade the markets with strict risk management to avoid surprises.
In short, Nifty has continued to hover around the 18000 mark and a strong directional move is still awaited. Move above 18115 can continue the rise but momentum will be crucial to see whereas any move back below 17915 followed by 17836 will provide the sign of weakness.
Happened: Prices move precisely as we mentioned and after the breakdown, Nifty made a low near 17798.20 exceeding our target!
Nifty / Bank Nifty calls – Want to trade index on intraday or positional basis – check here
Mentorship on Timing the Markets: Mentorship starts from 20th November that will ensure you become an Expert Trader with a clear defined strategy, disciplined approach, and science to forecast the markets. Time is the most essential element and we will provide over the period of 3 months all necessary tools required for one to become a profitable trader using Options. Simply fill the below form for more details OR Contact us on +919920422202.
