Nifty Volume Profile with Elliott Wave For Accurate Forecasting!
Dec 06, 2021
Like this Article? Share it with your friends!
Nifty has continued to be Sell On Rise that we have been mentioning over past many weeks. It has paid out well especially if you know how to Trade Options using Volume profile and Elliott wave.
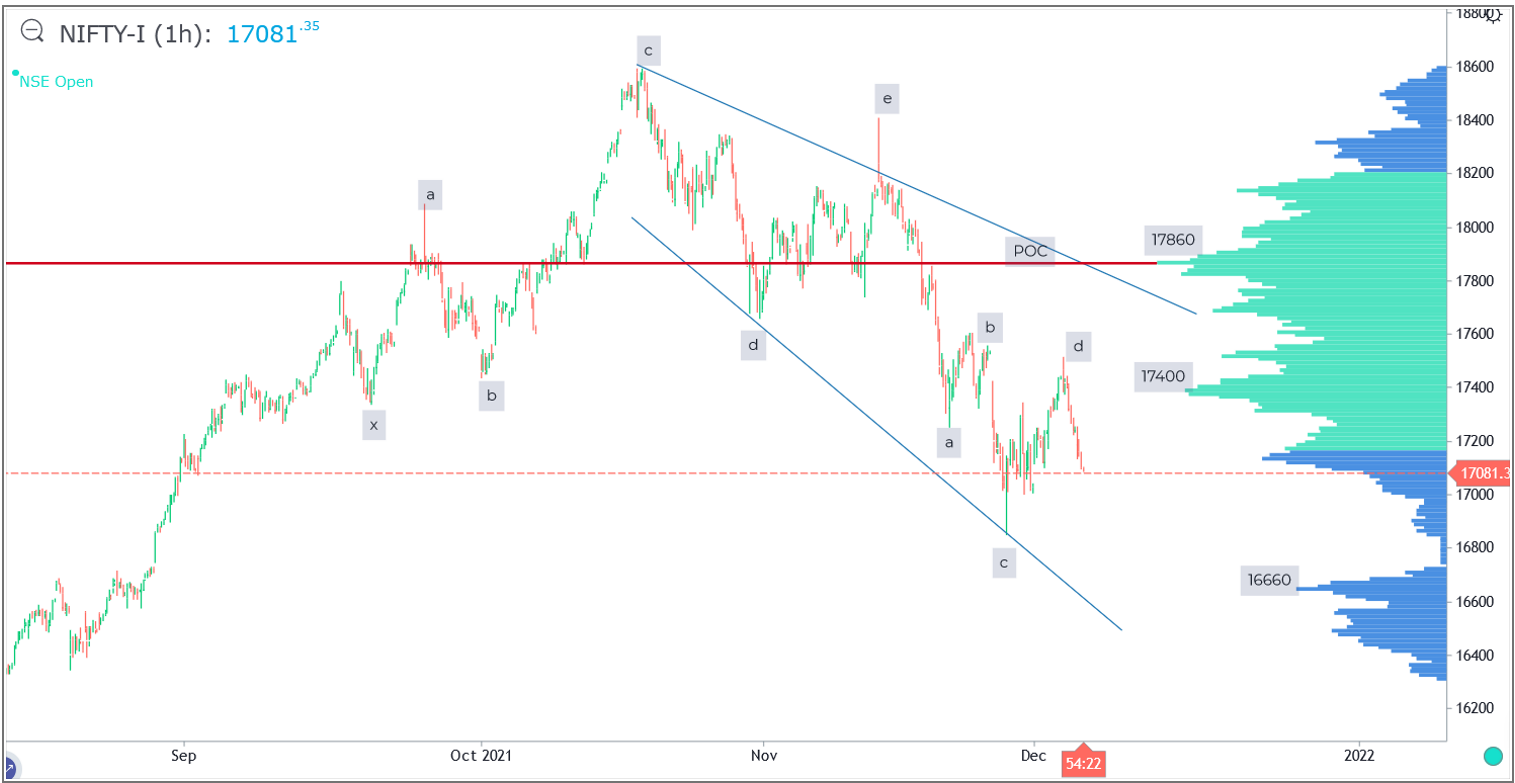
Below research shows Elliott wave pattern along with strong resistance where there is volume activity taken place. The Volume profile shows behind the scenes action when majority are focussed on price action or just volume and not the profile that represents at which price point major action is taking place.
Nifty Hourly chart Elliott wave with Volume profile

Elliott wave for Options Trading
Now by looking at the above chart, we can clearly see three important levels, 17860 – this is the Point of Control (POC) where the highest activity has taken place which looks like distribution by big players, next resistance level is at 17400 (futures) which is next highest volume node and the minor support is at 16660 (futures) level. Now given this information Option traders will understand the areas that are difficult for prices to breach given that a lot of volumes have taken place at those levels.
Elliott wave – As per the wave pattern prices are either forming a Diametric correction or a Triangle pattern. Currently wave e is ongoing which is just moving below the value area low levels. A sustainable close below 17000 will extend this wave e further on the downside for a move towards 16660. For a positive trend to emerge Nifty has to now break above 17400 levels as per Volume profile area.
Above research clearly shows that by combining this simple method of Volume profile along with Elliott wave one can form prudent option trading strategy, possibly of selling calls options of 17400 and 17900 strike prices and trade with an Edge.
Option Trading Using Technical Analysis (OTTA) - Learn to trade Options using Volume profile, Open Interest analysis, Bollinger Bands breakout strategy, Candlesticks and much more on 11th – 12th December 2021. Techniques can be applied for Intraday / Positional Option buying and selling, Generate passive income by systematic way of trading options, derive targets, profit levels, Option strategy – know more here
