Nifty 55 days’ Time Cycle with Neo wave and Open Interest Profile
Jul 05, 2023
Nifty has been moving in unchartered territory touching lifetime high levels.
Advanced Elliott wave – Neo wave along with Hurst’s Time cycles and Open Interest profile is one of the best combination to forecast and trade Stock, Indices or Options.
For Options Trading timing becomes all the more important and along with Options data we can see big players activity.
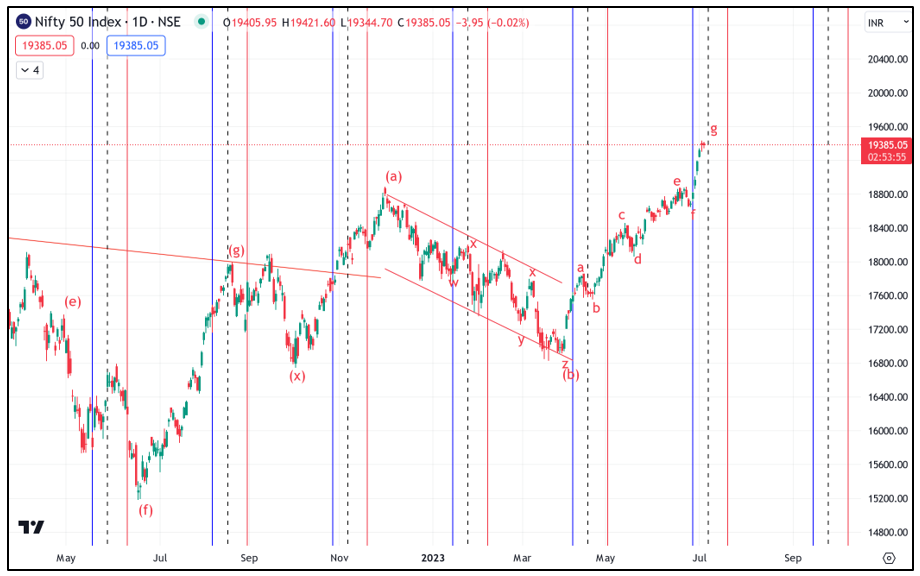
Below is Nifty daily chart showing Time cycle period with Neo wave counts.
Nifty Daily chart:
Nifty Open Interest profile -
Nifty daily chart shows sharp rise on upside post entering into the Time cycle zone. We can see that the low formed in the form of wave f is near 18646 is precisely on the blue cycle line post which Nifty rose by more than 800 points in just few days of time.
Hurst’s Time cycles - We usually look at the average cycle in middle which date falls on 6th July, But Time is dynamic and prices can form a low anywhere within the Time zone. This time it seems that the cycle low kicked in a bit earlier and prices formed a low on 27th June 2023 which is earlier than 6th July.
The low of cycle acts as important Time support. As per this the support is at 18646 from medium term perspective.
Neo wave analysis - As shown prices are moving higher precisely in form of Diametric pattern. We turned bullish during the first breakout near 17060 on 29th March 2023 and we have seen strong rise since then. This entire pattern on upside is 7 legged and currently the last leg in form of wave g is ongoing.
Post completion of wave g there can be either an x wave formation or reversal of the trend. Faster retracement below d-f trendline will be first indication that wave g is complete and opposite move has started. This trendline support is at 18720. A slower down move will indicate wave g is subdividing or x wave formation.
What is “x” wave? - x wave connects two standard corrections together. We can see that wave g is sharp and fast on upside and to retrace back below 18720 we need violent reversal which looks less likely as of now. Also prices are in the Time support zone as per 55 Days Time cycle and so it is less likely to fall back below 18720.
Open Interest profile – Options sellers data help to understand the big players activity. Change in open interest is also a vital information. Open Interest profile shows that 19400 both call and put sellers are active which means they are expecting prices to expire in the range of 19290 – 19490 levels. Sharp move above 19440 can however result into panic among call sellers who have been surprised everytime in this up move.
In a nutshell, trend remains up unless we see close below prior day’s low. Open interest data suggesting sideways action as of now and break above 19440 might be another opportunity for Option traders to take long positions either by buying calls or by selling Out of the money put options. As the trend is matured in form of wave g, it is better to sell puts options to ride this up move and not to have FOMO or Fear of Missing Out feeling.
Equity Research report – Subscribe to daily equity research report “The Financial Waves Short Term Update” and get detailed research on daily basis using Neo wave, Time cycles and 3 stocks that provides good trading opportunity with charts and explanation. This is the best way to see application and learn the Time tested methods. Subscribe annually and get monthly research free with medium to long term forecast on Nifty, Bank Nifty, Crude, Gold, Stock and much more – act now over here
3 Months of Mentorship – A Mentor can lead to transformation by sharing across decades of experience as a Trader and give a clear method, strategy and path that works in Trading Stocks, Options, Commodity or Forex. A complete plan, goal with methods to become disciplined and how to ride the trend using simple powerful techniques of Time along with Elliott wave. Early Bird is ending on 12th July 2023. Limited Seats only, Fill below form for more details


