Nifty Time Forecasting with 55 Days Hurst’s Time Cycles
Sep 14, 2020J. M. Hurst suggested that there are certain standard cycles which are universal and can be applied on any asset classes. Many cycle analysts often complain that cycles vanish without giving prior indication. The major reason is interaction of different cycles of varying magnitude.
The subject might look complicated but it is no different than Elliott wave principle. The major difference is Hurst Cycle analysis helps us to predict time and Elliott wave focuses more on price. This element of time can help us to forecast the Elliott wave pattern that can form in future.
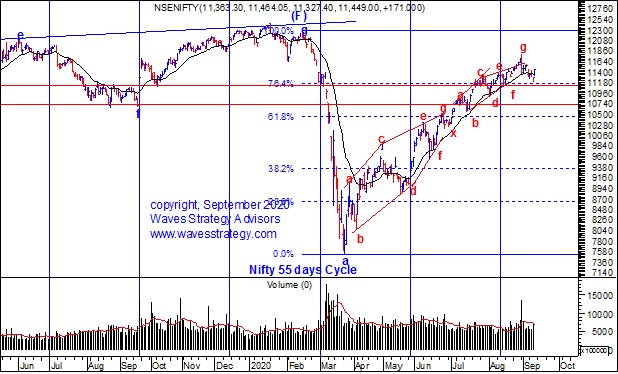
As shown in below chart we have applied Time cycle on Nifty Daily chart along with Neo Wave. The important part of Hurst Cycle is that if you know that major as well as smaller degree cycles are citing towards probable bottom or top then you can save yourself from making wrong trade. In market “when not to trade is the key to success”.
Below is the chart we published in our monthly report, “The Financial Waves Monthly Update”
Nifty daily chart- Time Cycles

(Below is the research taken from July Monthly Research Report)
Wave & Cycle Analysis:
As shown on the Nifty daily chart, the volume on that day was also sufficiently higher compared to that of the other days. It seems that a huge dump of stocks happened at the highs of the 11794 levels and taking it out in current month is going to be a big challenge.
55 days’ Time Cycle – This cycle has continued to work extremely well and it managed to form a low on the month of August as well. The low near 11,111 is also a 55 days cycle low and so the same should remain protected for the cycle to be in the buy mode. Breach below this will increase the probability that this cycle has topped out until the next low is formed.
This study of cycle analysis is independent of price forecasting that we do using Advanced Elliott wave i.e. Neo wave.
Imagine the power you will have if Time cycles and Neo wave price pattern both are in sync and pointing towards same direction.
I have discussed in much detail about 11,111 levels why it has still not taken out- in my latest webinar – You can watch it here
Get access now to the monthly research report – The Financial Waves Monthly update and see yourself the detailed analysis and where is the current rally going to fizzle out. Check here
ONLINE training on MASTER OF CYCLES becoming from novice trader to an expert trader using advanced concepts of Hurst’s Time cycles. Register now and avail early bird offer ends on 15th September Know more here
