Nifty Time Cycles with Neo Wave, Channels, Average, RSI
May 12, 2020Nifty has moved against majority who were expecting a sharp rally on upside.Application of Time Cycles with Elliott Wave – Neo Wave, Channels,Moving average and RSI at its best.
Following charts are published in the latest monthly research report – The Financial Waves Monthly update.
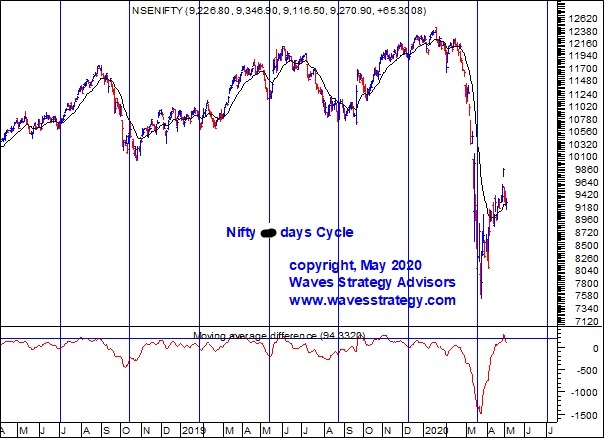
Nifty daily chart with Time cycles
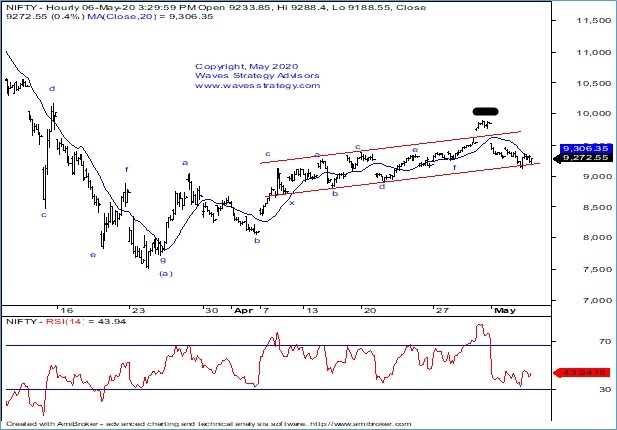
Nifty hourly chart – Elliott wave counts, Channels, Moving average, RSI
Following was mentioned in the monthly research report –
Nifty ??? days Time cycle: We have been trying to search for a cycle that overlapped with the low formed on 24th March 2020, near 7511 levels. This resulted into a …….. days cycle. This is not as per Hurst’s Time cycle method but nevertheless is proving out to be capturing important lows. One can understand that the major lows formed on Nifty has been most of the times on this ……..days cycle with minor deviations only on a few occasions. The next low as per this cycle is near …………..2020. We have already consumed …….. days in this cycle which on an average tops out around …….. days. Moving average difference indicators shown at the bottom of the chart clearly provide cyclicality behaviour and also highlight the overbought zone. The same indicator is now turning back below 0 which means the shorter moving average is crossing back below the bigger average and is entering into the sell cycle mode. Let us see if the crucial support level near 9100 can remain protected or we start seeing accelerated selling pressure below this level which will open up trend towards …….. followed by ………. levels.
(Important levels are omitted from above purposely as shown in the actual research report published to clients)
Nifty hourly chart: Reason for showing this short term chart is to highlight that prices are moving at very important juncture which is the lower red channel.Decisive close below this channel near ……… levels might indicate completion of the entire retracement on upside in form of wave (b) and probable start of wave(c) lower. Also as wave (b) did not consume more time than wave (a) and did not even retrace more than 61.8% of wave (a) there is high possibility that we are either forming an Extracting Triangle or a Diametric pattern. The Diametric pattern will be strongly bearish but it is prudent to take one step at a time and see as and when wave (c) progresses to downside.
In a nutshell, Nifty is now at crucial juncture. Decisive close below …….. will increase the odds of downside breakout for a trend towards ……….
Above clearly shows how various methods can be combined together to derive high conviction trade setups.
Get ready to ride the next big trend again! Will Nifty resume wave (c) lower and if yes what are the target levels. Subscribe to the Monthly research and Short term Equity research report to see how to ride the next big trend. Get access here
Mentorship June 2020 – I am going to share across how to convert research into a trading signal using the above methods with hand holding each of the Mentees and the trades that they are taking. Application of theory along with trading psychology is must to become a successful trader. To register contact on+919920422202 or visit here
