Nifty PE Ratio Nearing 35 and AD Line Deteriorating, What is Next?
Oct 13, 2020Technical analysis applied on Fundamental indicator like Price to Earnings ratio can give amazing outlook on is it time to invest in the index or not.
Let us understand the Price to Earnings ratio (PE ratio) and why everyone is so bullish for a big move.
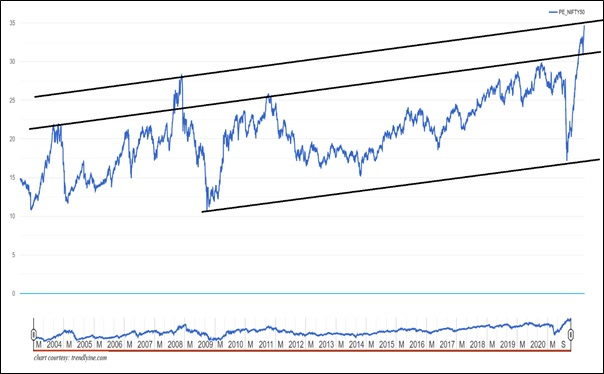
Nifty PE ratio:

Above chart shows that a basic fundamental parameter is following the technical channel so extremely well. Why not, it is derived out of prices itself and earnings also follow a pattern. We can see that the upper end of the PE ratio is now reached. For this ratio to move lower either prices have to fall or the earnings have to increase provided prices remain in same level. Now, prices cannot be constant and so it has to fluctuate. Given that the upside room is so less it is sending across warning signs for investors who wants to pump in fresh money. However, do understand that post one leg on downside the bigger bull market will start but we think that will happen only post April 2021 and by end of November 2021. Until then we can expect a Big triangle pattern to form on Nifty. It makes perfect sense that prices should not move and earnings should catch up. Now prices has to move but on net basis it can still remain in a zone. Case in point is this PE ratio conforms to our wave pattern expectation that the ongoing wave G of primary degree is going to form a big triangle and we are currently in of the pattern (detailed research showed in Monthly research report). Post this there will be once we see faster retracement of the last rising segment which has not happened. Fundamentalist will try to justify every PE levels that the earning were bad in past quarter but don’t you think markets rallied by already discounting it!
As a trader understand this is a long term chart and one cannot take short positions by looking above. This is to set overall broader context but unless faster retracement is seen below important support levels markets are in positive MANIAC zone.
Get access to the Equity research report annually and get the “The Financial Waves Monthly Update” complimentary along with it. See more than 15 charts and all are interconnected. Subscribe here annually and my team will setup access to monthly free. Offer valid only for limited registrations.
Join me for the 3 months of Mentorship on Technical analysis starts in November 2020. It is important to understand how everything in connected together whether it is a fundamental or a technical parameter. I will be sharing more than decades of experience over the period and ensure you become a much better trader. There will be Q&A sessions and discussions ongoing post mentorship as well. So it is a long term association and commitment from my end to make you a wonderful Trader. Early Bird Ends on 25th October 2020.
