Nifty Midcap index – Will it outperform in this fall?
Jan 20, 2020Nifty Midcap index has been hit badly over past year but will 2020 we will see its outperformance?
See the below research published on 9th January 2020 in “The Financial Waves Monthly update”
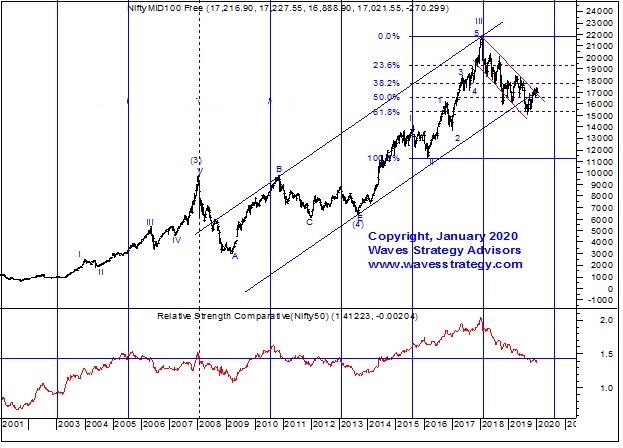
Nifty Midcap weekly chart

Elliott wave analysis:
Nifty Midcap index seems to be moving in the form of wave IV which we cited many months before. It worked out to the point of 61.8% retracement of the entire rise of wave III and halted there. We are now just breaking out of the long term red trendline and there is possibility that wave V might be starting higher. This is a bold call at this stage where the midcap index and stocks have drastically underperformed. But it seems investors are running out of stocks from the largecap space which has already become too expensive and now Midcap should start becoming the flavour.
As wave IV was deep wave V might be truncated and retrace towards 61.8% – 76.4% of wave IV (as wave IV was double corrective) giving a target of …………
To gauge this look at Midcap to Nifty ratio chart: The ratio shown below the midcap index is now back towards the mean level of 1.4. This suggests that we should start seeing some outperformance in the Midcap space which has been badly beaten down. However, these outlook will remain valid as long as Nifty does not break below ……….. levels decisively on monthly closing basis which is the monthly low as well as important cycle low.
In a nutshell, we can see some positive action on Nifty towards 12350 – 12440 levels in form of wave g post which the topping process can start. BANG ON! Nifty touched the high of 12430 and reversed on downside. So, What is next from here?
Get access to detailed research of Monthly and Equity and look at crucial levels we have been talking about. Nifty has reversed after touching the targets on upside.
Subscribe to the various research under Republic day offer and get upto 50% less price. Know more here
