Nifty Elliott Wave Pattern with Channels
May 19, 2020Nifty advanced Elliott wave – Neo wave plot is unique way of looking at price chart. It helps is identifying each wave movement very clearly. In below research we have shown application of Elliott Wave – Neo Wave pattern, Channels, at its best.
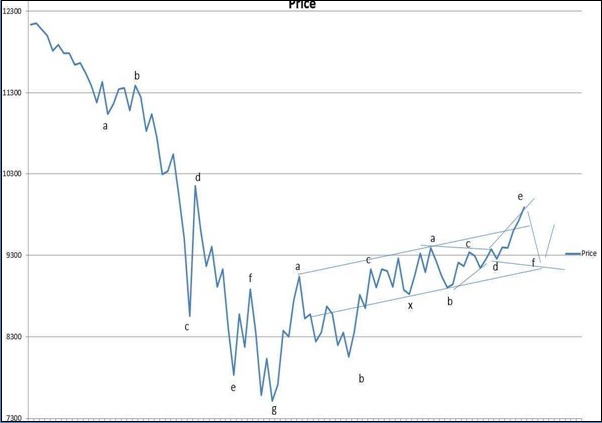
Look at the below chart of Nifty. The below research was published on 04th May 2020 in the morning daily research report –The Financial Waves short term update
Nifty Daily Neo wave plot: (Anticipated as on 04th May 2020 morning before markets opened)
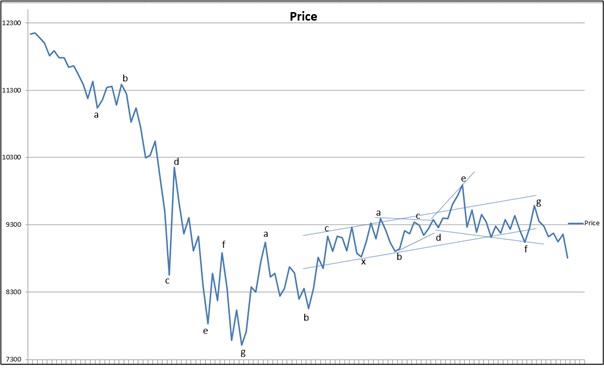
Nifty Daily Neo wave plot: (Happened as of now)
Wave Analysis
On 4th may as Nifty had broken critical resistance levels above 9600 with a big gap up, most retail participants entered long positions with the fear of missing out on this rally.
But in our Daily nifty research report we had advised our clients to avoid taking long positions as this move was going to be short lived and a failed breakout that would trap the novice traders on the wrong side of the market.
In our daily report on 4th May, we had shown the Neo wave plot of Nifty and anticipated the path it would take even before the gap down! You can see clearly that as we anticipated wave f on the downside and then one last bounce to the upside. This prediction was based on a pattern called the diametric pattern of the Neo wave and the result was we were two steps ahead of the market quite literally!
We have been generating advisory calls on Nifty, Bank Nifty, Stocks, Commodity and Currency using such advanced technical analysis methods and it has worked out extremely well. You can avail combo research at never before pricing under the Summer Offer 2020. Check here
Mentorship June 2020 – I am going to share across how to convert research into a trading signal using the above methods with handholding each of the Mentees and the trades that they are taking. Application of theory along with trading psychology is must to become a successful trader. To register contact on +919920422202 or visit here
