Nifty Bollinger Bands® with Neo wave, Why 17830 Crucial?
Sep 01, 2022
Like this Article? Share it with your friends!
Bollinger Bands and Neo wave can be powerful combination to get range limit along with forecasting ability.
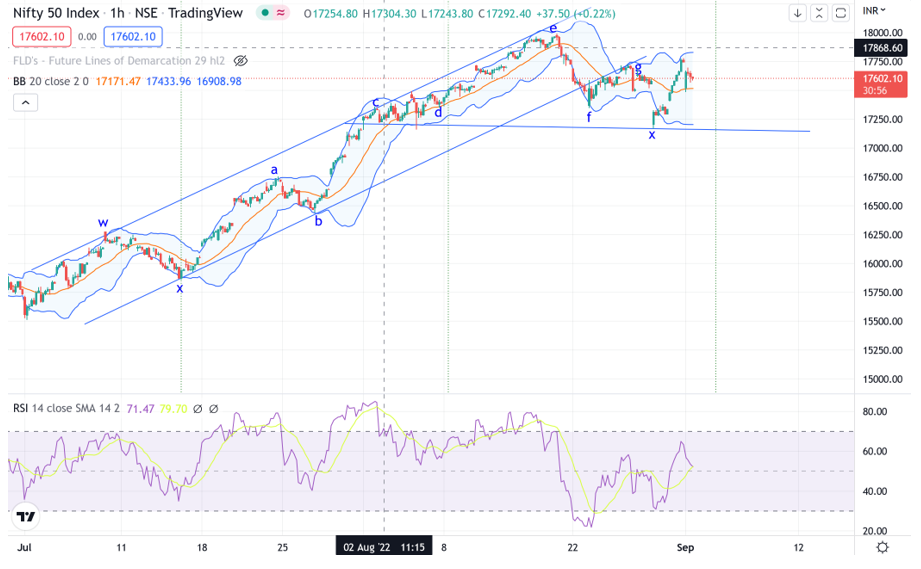
Below we have shown chart of Nifty along with Bollinger Bands and possible Elliott wave – Neo wave counts.
Nifty hourly chart:

Above chart shows that prices have been moving in double corrective pattern and the fall we saw on 29th August 2022 was only wave x as prices sharply recovered back above the Gap area.
A sharp fall followed by sharp rise results into a triangle pattern formation and the rise could have been wave a and now we are in wave b formation.
During sideways action Bollinger Bands work extremely well. As we can see in above chart support as per bands is near 17200 levels and resistance is at 17830 on upside. This is a big enough range but given the recent volatility such moves can be expected. The Bands can start contracting showing non trending behavior and range should reduce. Post the triangle pattern completion we will see a trending move to emerge.
In a nutshell, combination of Bollinger Bands with Neo wave can give a complete trade setup for traders as they can understand the maturity of trend and form classic Options Trading Strategy for low risk high reward trades. As after the range is done a strong trend will emerge where buying options will give multifold returns.
Learn Elliott Wave, Neo wave with Time Cycles and Indicators - Master of Waves scheduled on 17th – 18th September 2022, Register now and get access to the following –
- Live sessions on 17th – 18th September 2022
- Access to 6 hours of Elliott wave videos before the Live session
- Access to 1 month of Equity research with application of methods learnt
- 5 Bonus videos for Lifetime
- Trade setups and rules for applying the techniques prudently
- Pre- session before the Live training
- Post session after the training for Handholding and Q&A
Time is now to trade with an Edge. Limited seats only, Register here
