MAZDOCK PATH PREDICTED USING ADVANCED TOOLS!
Mar 07, 2025
When we combine Neo wave along with technical indicators like Bollinger bands it helps to form powerful setups with accuracy. See how we captured a significant move in Mazdock stock by applying Bollinger band and check how Mazdock has been moving precisely as per the counts.
We published the following research on Mazdock on 03rd March 2025 in the “Vayu Momentum Report” which our subscribers receive pre-market every day.
Mazdock Daily Chart Anticipated as on 03rd March 2025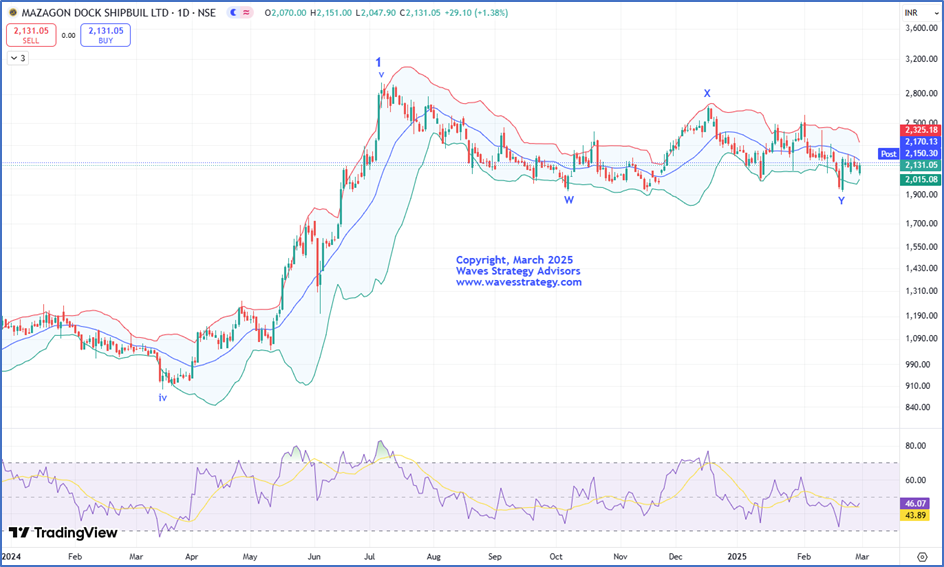 Wave analysis as on 03rd March 2025-
In the previous session, MAZDOCK gained more than 1% despite major indices falling which is a positive signal. In the previous week, prices reversed from the important support of 1926 and a sharp bounce of more than 15% was seen. Now prices are trading close to the mid Bollinger bands® post reversing from the lower bands. A decisive break above mid bands i.e. above 2170 is required to confirm about the short-term trend change.
As per wave perspective, primary wave 1 got completed on the upside near the top made in July 2024. Since then, the correction is in form of wave 2. The internal structure of wave 2 looks to be in form of complex correction (W-X-Y). We are expecting wave Y to get complete on the downside. For confirmation follow up buying is required.
In nutshell, Mazgaon Dock Shipbuild Ltd is at deciding point. A break above 2170 can result into fresh buying which can lift the price higher towards 2255 followed by 2330. On the downside 2080 is the nearest support.
Key Resistance: 2330
Key Support: 2080
Strategy: Long positions can be created above 2170 with the stoploss of 2080 and target of 2255 followed by 2330 levels.
Mazdock Hourly Chart Happened as on 07th March 2025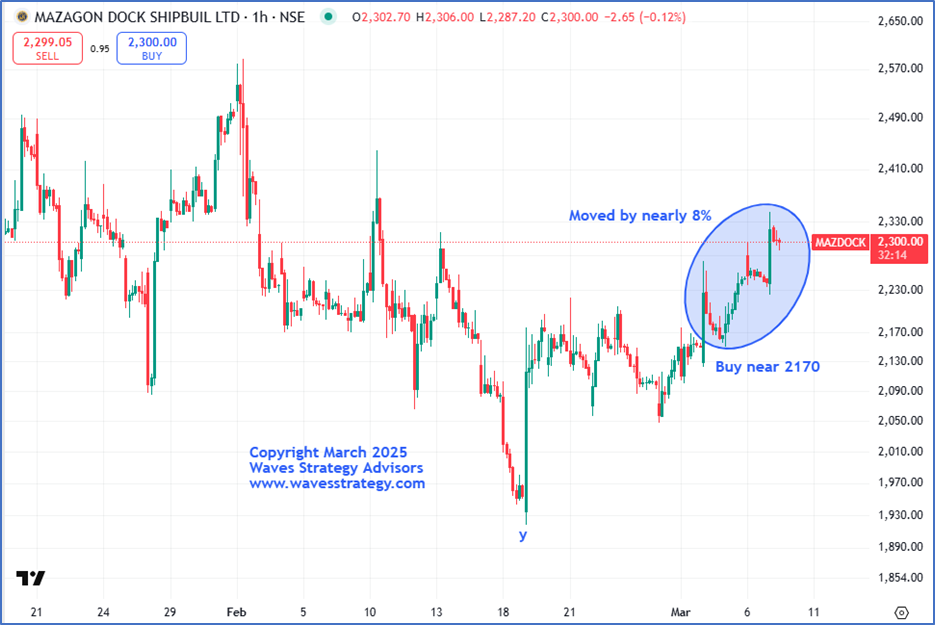
Happened: Mazdock has been moving in sync with our Elliott wave counts. Wherein, we anticipated that with follow up buying internal wave y will get completed on the downside and BANG ON!! Prices moved as expected and witnessed a rise of nearly 8% The stock managed to achieve both our given targets and made a high of 2344 levels.
We successfully captured this entire up move with the help of simple price indicators like Bollinger bands. One needs to combine it with price action for more accurate results!
In a nutshell, wave y has competed on the downside and now a fresh leg is unfolding on the upside. For now, a break above 2345 levels can lift the prices towards its previous swing high of 2590 levels or higher. On the downside, 2110 levels is the nearest support to watch out for!
It is fascinating to see how accurately Elliott wave along with simple indicators like ADX can help to predict price targets with accuracy.
Brahmastra (Mentorship) on Trading – Learn the science of forecasting using Time and Elliott wave, Neo wave along with risk money management, stock selection algo, Options trading with complete plan. Limited seats only, Next batch starts in March 2025. Fill below form for more details: