LIC Housing Finance: Trade using Combined wave theory with Ichimoku Cloud
May 20, 2020Most of the NBFC’s failed to show any positive attempt even though the 1st setof stimulus was meant to benefit them the most. Despite of it stocks like IBULL Housing, L&TFH, LIC Housing are falling steeply.
Despite an eventful week stocks are not moving as per the after effects of news on them. Our application of Elliott wave with combination of various indicators is helping us to gauge the movement prior its happening. Below is one of the examples of Elliott – Neo wave Diametric pattern with Ichimoku cloud.
On 15th may 2020 in “The Financial Waves short term update” we published detailed Elliott wave counts along with application of Ichimoku Cloud on LIC Housings Finance.
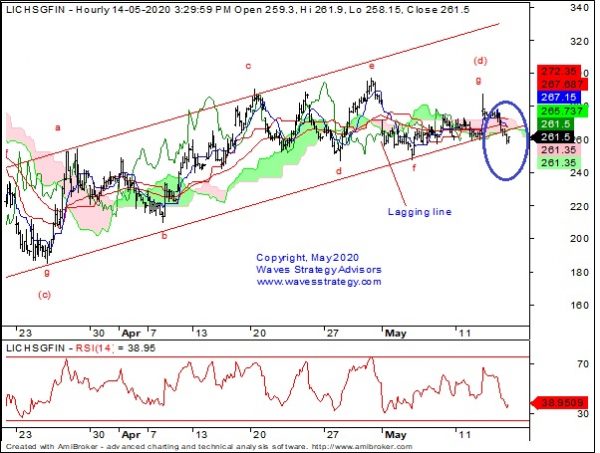
LIC Housing Finance 60 mins chart: (Anticipated as on 15th May 2020)
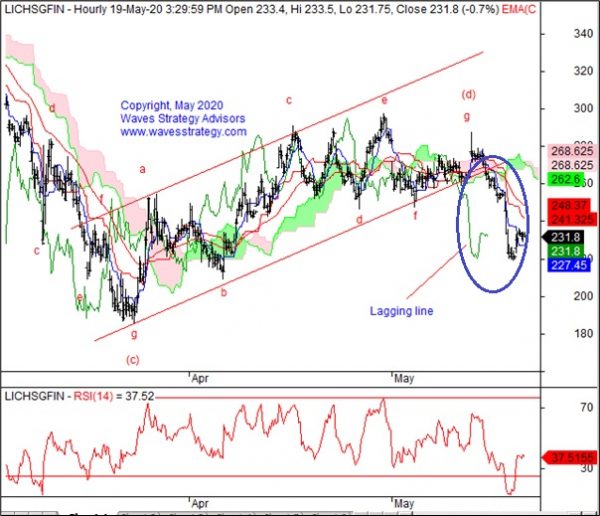
LIC Housing Finance 60 mins chart: (Happened of now)
The following was published on 15th May in daily equity report “The Financial Waves short term update” before markets opened
Wave analysis:
As shown on daily chart, ———- Currently wave z (blue) of intermediate degree is ongoing in the form of Diametric pattern we are expecting wave (e) (red) to unfold on downside. (detail study mentioned in actual research report)
As shown on hourly chart, the stock has closed below the channel. As seen on Ichimoku cloud prices are placed below the cloud hinting to continue with down move. Also after many attempts the lagging line is placed below the prices and cloud which strong indicates negative bias.
In short, the trend for LICHSGFIN seems to be bearish. A break below 255 levels will indicate the deeper downtrend towards 230 levels. This view is valid as long as 275 stay protected on upside.
Happened : Prices moved precisely as expected in line with indicators direction and neo wave pattern also it broke below the channel support decisively. We expected the deeper down move towards 230 levels and it happened as forecasted and Ichimoku clouds still giving sell side signal.
The above just shows how one indicator itself can provide very important information to derive the trade and when combined with Elliott wave – Neo wave pattern it becomes all the more powerful.
Get access to stock tips, Nifty and Bank Nifty calls along with daily research report to ride the ongoing trend in the market. Grab this opportunity under our SUMMER SPECIAL OFFER deal like never before. Get access here
Testimonials of Mentorship batch Feb 2020
• Nikhil Kohli – Great to have you as a mentor Ashish. It has given me immense confidence to combine all the techniques and build a method, a system for an objective approach to trading. I was always looking for a mentor and I found one in Ashish. Many thanks
• Rakesh Ambudkar – Great Mentor. Keeps things logical and simple. And a Humble person. Hats off to your mentoring skills. That differentiates. Thank you
You can be next lucky one to get hands on much detailed and rigorous training program in our Next Mentorship June 2020 we will be covering Ichimoku cloud, Bollinger bands and various such indicators in much detail and depth. To become an expert trader – you can register now for the same, Limited seats. Register here
