JSWSTEEL hits 52 weeks high, what is next from here on?
Mar 03, 2021
JSWSTEEL had been moving in a rising channel and consolidating near its 52 weeks high. The stock has scaled to new life time high today!
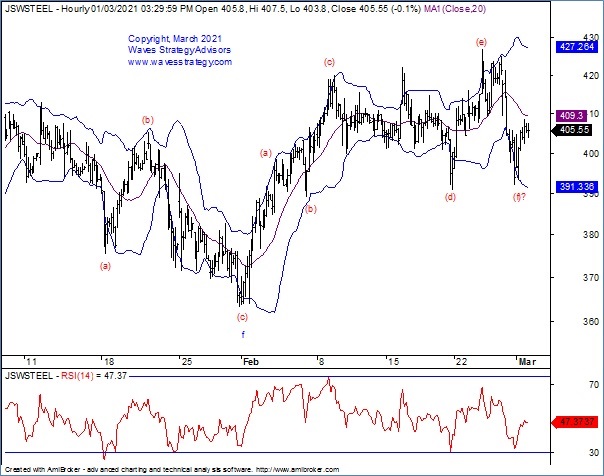
Look at the below chart of JSWSTEEL published in the equity research report on 02nd March morning before markets opened – The Financial Waves short term update.
JSWSTEEL hourly chart: (Anticipated as on 2nd March 2021)

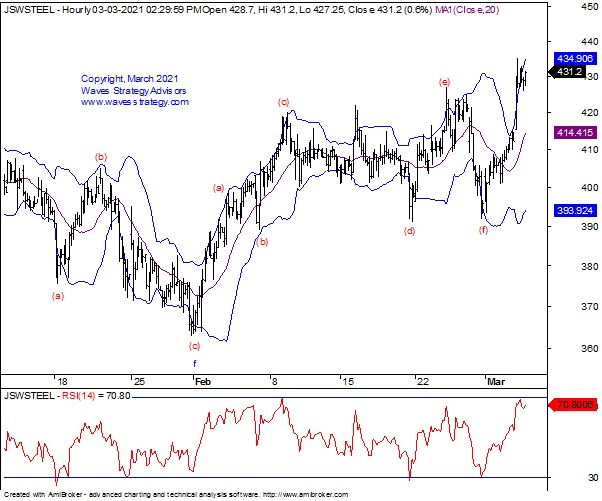
JSWSTEEL hourly chart: (Happened as on 3rd March 2021)

Wave analysis: Following was mentioned on 2nd March 2021.when the stock was near 405 levels.
JSWSTEEL is consolidating near its 52 weeks high. In the previous trading session the stock formed a hammer like inside candle.
As shown on daily chart, price is trading within the rising channel in the form of wave g. price has bounced from the channel support but as per bar technique the short term bias is still negative as long as we do not see a close above previous day’s high.
As shown on the hourly chart, a break below 390 will indicate that (f) is still ongoing and we could see a deeper correction. Whereas a break above 412 will confirm that (f) is in place and wave (g) has started on the upside
In short, JSW steel is in crucial junction. A break above 415 can take price higher towards 429 as long as 400 levels hold on the downside and a break below 390 can take price lower towards 379 as long as 410 levels hold on the upside.
Happened: The stock performed precisely as expected it made its lifetime high near 435 levels on 3rd March 2021.
