ITC - Identifying bottoms Using Time Cycle
Apr 07, 2025
Time Cycle is a Technical Analysis study and it is surprising that such concepts can help to time the market and catch early reversals which improves decision making of the traders.
J.M. Hurst defined that there are standard cycles that exists and it is possible to identify the actual cycles on the stock market.
ITC Daily chart with 55 Days’ Time Cycle.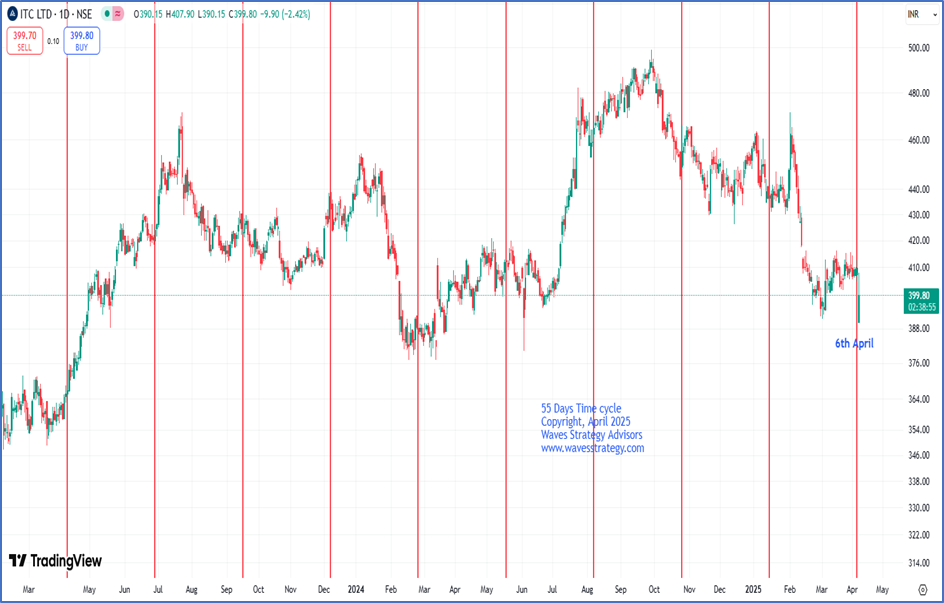 We have applied 55-period cycle on the daily chart and we can observe how prices have been following our plotted cycle. Currently, we have entered into the cycle zone for ITC. For now, the cycle can turn on the buy side once prices break above its previous swing high level which is near 417 levels.
In a nutshell, ITC is at an important juncture. As the stock has entered into its cycle zone. Next few days price action is important, a breach above 417 levels is needed for cycle to turn on the buy side. On the other hand, on the downside 390 is the nearest support to watch out for!
Above research shows power of Time trading and one need to not worry about not missing out the trend as when time is in favour, then we can catch moves well in advance if price action confirms.
Brahmastra (Mentorship) on Timing the market – Learn the complete science of Trading using technical analysis, risk money management, time trading techniques, complete handholding, and lifelong association in an upcoming mentorship program with the live trading session, Fill below form for more details