How to use Price Patterns with Indicators for analysing stocks
Dec 27, 2021
Like this Article? Share it with your friends!
It is possible to capture explosive moves in stocks using price patterns and simple indicators like the Ichimoku cloud. Check out how we selected HIRECT which has rallied more than 13% within 4 days.
We published the following research on HIRECT pre-market on 23rd December 2021 in "The Financial Waves Short Term Update” which our subscribers receive pre-market every day.
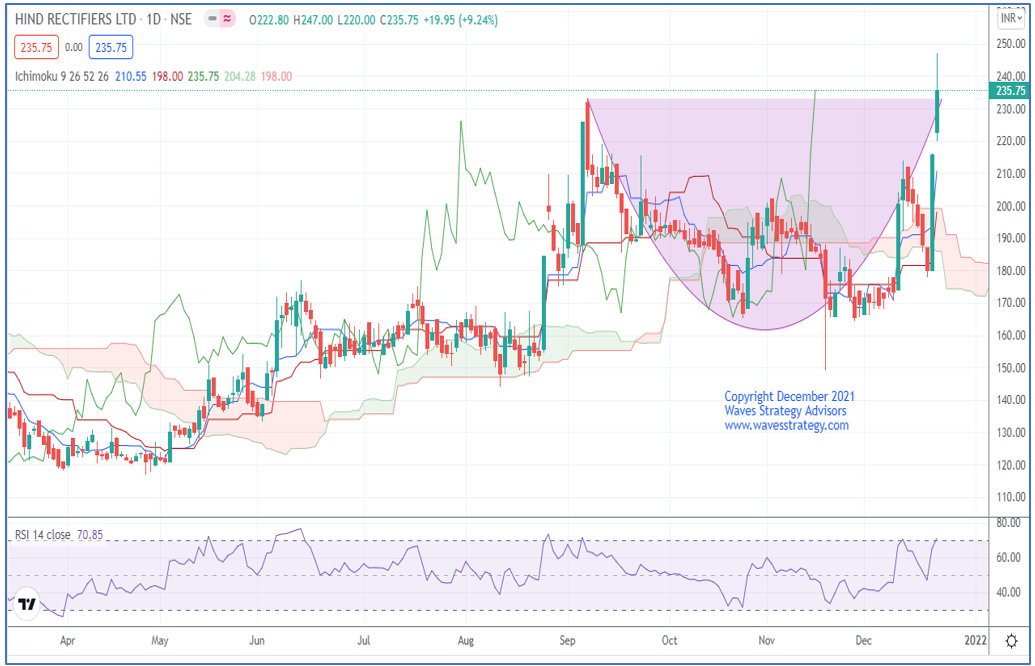
HIRECT Daily chart as on 23rd December 2021 (Anticipated):

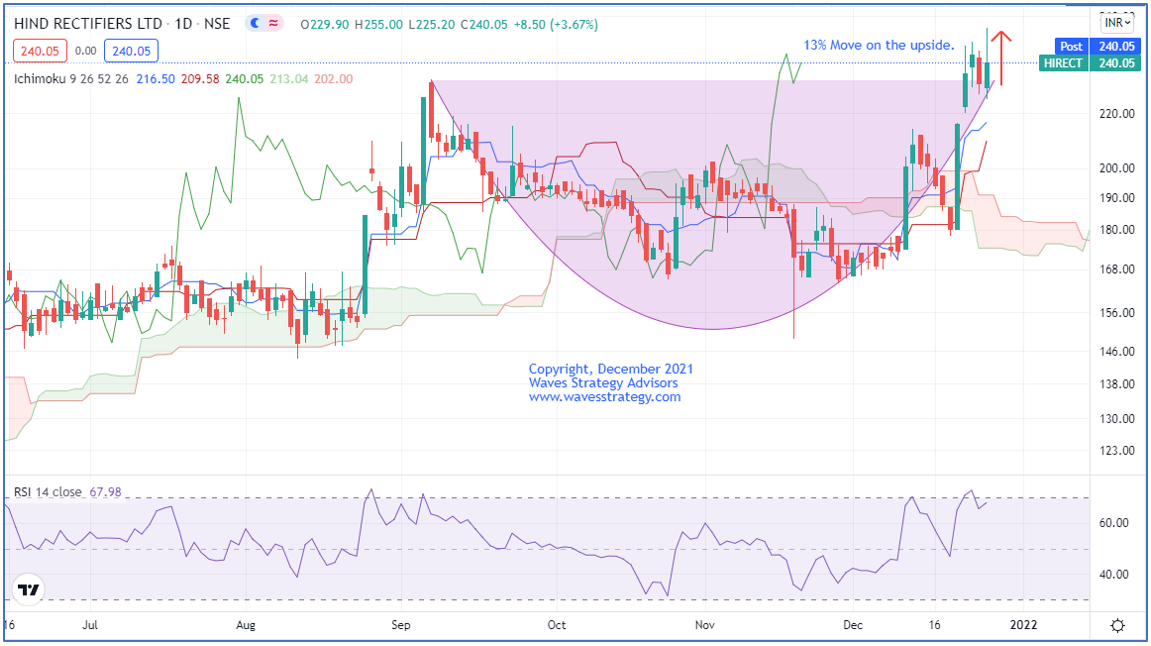
HIRECT Daily chart as on 27th December 2021 (Happened):
 Waves analysis as published on 23rd December 2021:
On the daily chart, in the previous session prices formed a bullish candle. Prices have given close above 233 level which confirms breakout from the pattern. The stock is trading above Ichimoku cloud which indicates that the short-term bias is bullish. The RSI was also near the overbought region which gave us an indication that we can expect a minor dip.
In short, the trend for this stock is positive. Use dips towards 230-225 as buying opportunity for a move towards 255-260 levels as long as 210 holds on the downside.
Happened: After we published the report, the stock dipped towards 225 levels as we expected and within a short span it gave a return of more than 13% and achieved the target near 255 levels.
Christmas Offer - Get access to Intraday / Positional calls directly on WhatsApp / SMS and receive research report free along with it “The Financial Waves Short Term Update” that contains a view on Nifty and stocks that can provide a trading opportunity. Get it under the ongoing Offer. Subscribe Here
Master of Waves – Learn complete Elliott wave, Neo wave along with Time Cycles and equip with excellent trade setups for trading Intraday and positional along with forecasting the markets from very hour, day and months. 2 Days of Live event on 15th – 16th January 2022, Know more here
