Copper: Has NO Looking Back! Check the Movement of Terminal Pattern
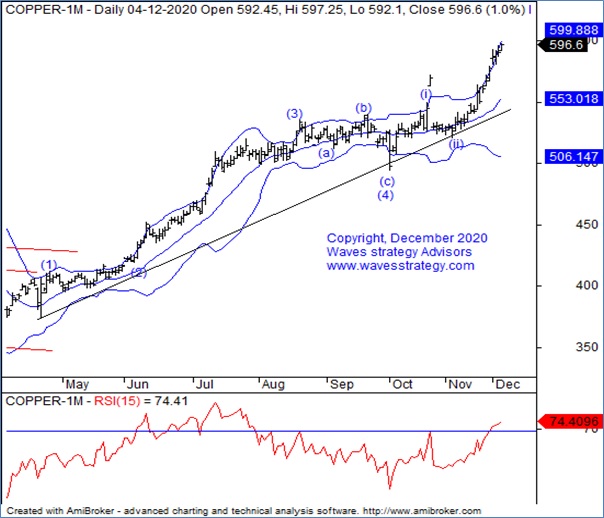
Dec 07, 2020Copper continues to be in wave 3 of the terminal impulse. Prices are drifting upwards and have not given a single close below the prior low since the onset of wave 3.
Below is the daily chart of MCX Copper with detail analysis using Bollinger band combined with Elliot Wave theory which was published in our monthly research report “The Financial Waves Monthly Update”
MCX Copper Daily chart:

Wave Analysis:
Copper saw gap down post forming a high near 549 levels. Now, prices are showing signs of retracement on the upside. It is important now to look at the medium term structure to understand the overall pattern. Now, it’s important to see if prices give breakout of its immediate resistance of range on closing basis than the bulls will probably challenge the previous top which is seen at 549 levels. Alternatively, additional declines may drive the price towards the 505-500 support, which lies near the 20-week exponential moving average.
Elliott Wave perspective: on weekly chart, we are seeing the impulsive rise of wave 5 blue currently the last leg in the impulse pattern is unfolding in the form of wave (5) blue. This last leg is a terminal impulse with wave (ii) might have completed near the lows of 523.
As seen on daily chart, currently the up move can be seen in the form of wave (iii) of the terminal impulse. In a terminal impulse, all the waves are expected to be corrective in nature.
The 20 period Exponential Moving Average is acting as a brilliant support line and it has provided support at regular intervals. This suggest that one should be in the direction of the on-going trend as far as this line is protected and any pullback towards the same should be utilized as buying opportunity.
Bollinger bands continue to provide important support and resistance. So unless we start seeing bands expansion and decisive close above or below these bands prices can continue to consolidate. As we can see, post taking support near the lower bands prices have moved higher. Also if we see copper breaking above the upper band we can say that an upward rally has begun.
In a nutshell, the outlook for Copper looks to be sideways to positive. For a bigger degree uptrend to resume prices might inch towards 549 or higher levels. As long as 490 levels is protected on downside, the trend continues to be bullish.
To get more long term insights about other commodities you can also subscribe to our monthly report published under the name of “The Financial Waves Monthly Update”– Check here
You can subscribe to the Intraday / Positional calls on commodity and get detailed research along with it explaining the clear technical picture using Elliott wave, indicators and much more. Get access here.
Get strategies which could be applied across all segments in the upcoming ONLINE training –Become Market Wizard learn about Neo wave, Elliott wave, Time cycle. Dedicated discussion groups will be created to keep the learning going in future. Register now only limited seats and Early Bird Offers Ends on 12th December 2020 Know more here
