BSE PATH PREDICTED USING ADVANCED TOOLS!
Apr 23, 2025
When we combine Neo wave along with technical indicators like KST (Know sure thing) it helps to form powerful setups with accuracy. See how we captured a significant move in BSE stock by applying KST and check how BSE has been moving precisely as per the counts.
We published the following research on BSE on 7th April 2025 in the “Vayu Momentum Report” which our subscribers receive pre-market every day.
BSE Daily Chart Anticipated as on 7th April 2025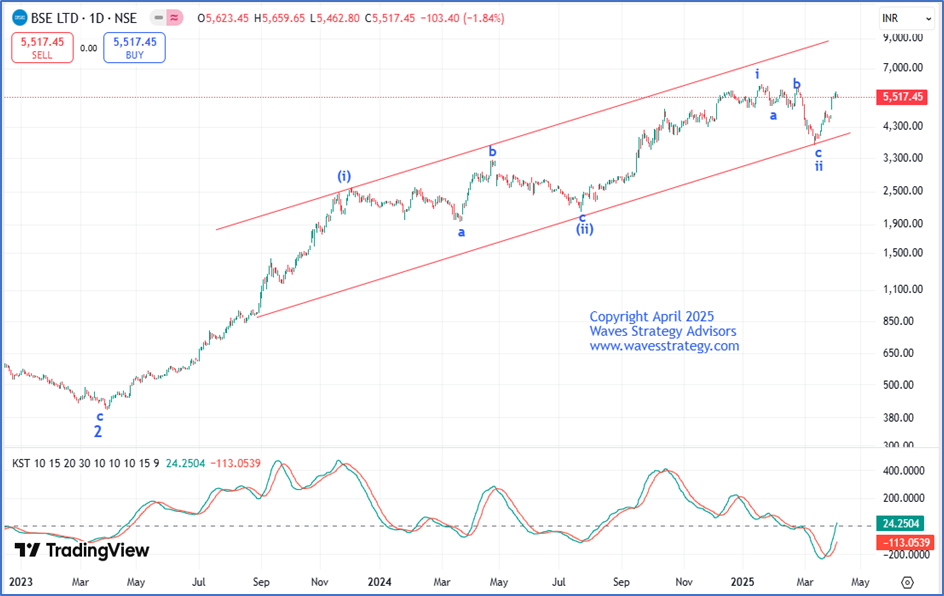 Wave analysis as on 7th April 2025-
On the daily chart, post reversing from its channel’s support BSE has gained more than 50% in less than one month of span which is a strong bullish sign. Currently, BSE is digesting its steep rise and is trading in a lackluster manner for the past few sessions. A break above its prior day’s high is must to suggest that buying has resumed in the stock. Also, we have applied KST to gauge overall momentum in the asset. Wherein, it has recently witnessed a crossover and now a breach above the zero line can further boost buying in the stock.
As per the wave perspective, recently wave i of intermediate wave (iii) got completed on the upside. Since then, the entire fall has been unfolding in the form of wave ii which was in the form of a flat pattern (3-3-5). For now, the current rise is in the form of wave iii of intermediate wave (iii). As per the Elliott wave guidelines, it is considered to be the strongest and most trending wave.
In a nutshell, BSE is currently consolidating at higher end. A break above 5680 levels can resume buying towards 5850 followed by 6040 levels. On the downside, 5470 is the nearest support to watch out for!
Trading strategy for Intraday Futures – Long positions can be created above 5660 levels with the stoploss of 5632 and target of 5688 followed by 5716 levels.
Trading strategy for Positional Futures – Long positions can be created above 5660 levels with the stoploss of 5608 and target of 5760 levels. (One can book partial profit near 5700-5710 levels and trail stoploss to cost.)
BSE Hourly Chart Happened as 23rd April 2024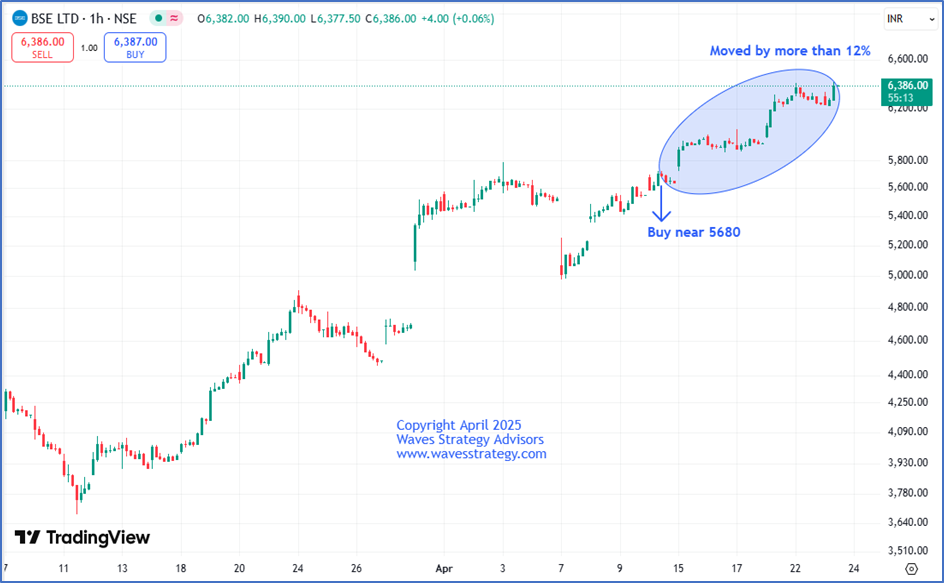 Happened as on 23rd April 2025:
BSE has been in sync with our expectation as after we published the report, the stock has moved as expected and BANG ON!! BSE managed to surge by more than 12% in a short span of time and made a fresh high of 6455 levels which is a strong bullish sign. Also, the stock has managed to achieve our given target not only in cash segment but also in the future segment.
We successfully captured this entire up move with the help of simple indicator like KST (Know sure thing). One needs to combine it with price action for more accurate setups.
It is fascinating to see how accurately Elliott wave along with simple indicators can help to predict price targets with accuracy.
Brahmastra (Mentorship) on Trading - Learn the science of forecasting using Time and Elliott wave, Neo wave, along with risk money management, stock selection algo, Options trading with a complete plan. Limited seats only, Next batch starts in April 2025. Fill below form for more details