Patanjali Bang on!! Combining Price action and Bollinger bands!
Apr 16, 2025
When combining basic price patterns with technical indicators like Bollinger Bands, one can effectively capture significant movements in stocks. See how we chose Patanjali that achieved our targets in futures and options segment.
Check out how we selected Patanjali which has rallied more than 5% in 2 trading session despite market fluctuations. We published the following research on Patanjali pre-market on 15th April in "Vayu Momentum Report” which our subscribers receive pre-market every day.
Patanjali Daily Chart: Anticipated as on 15th April 2025
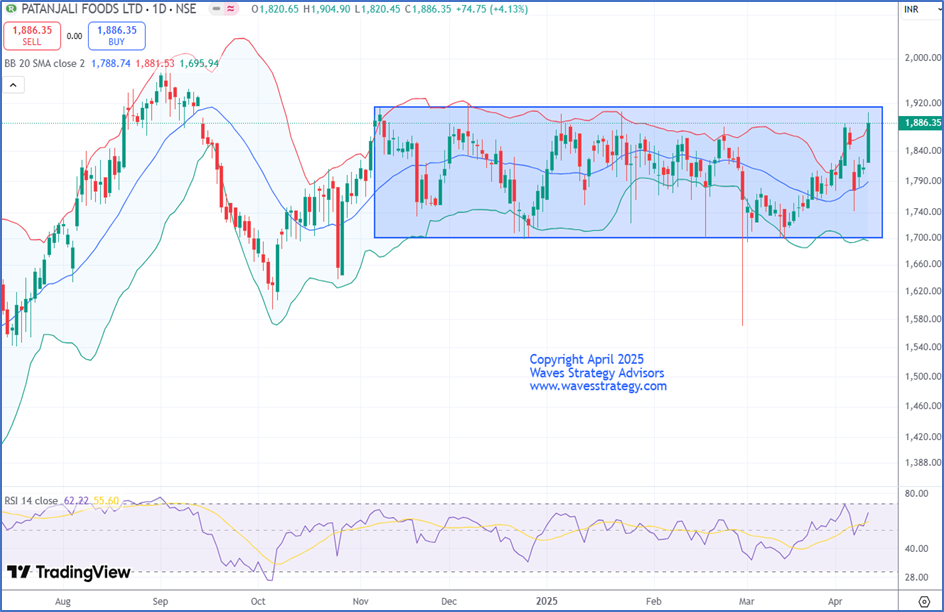
Wave Analysis as on 15th April 2025:
PATANJALI closed on a positive note with a massive gain of 4.13%. The stock is moving in a rectangular range over the last few days indicating accumulation in the stock. A daily close above 1915 levels will confirm breakout of the said pattern.
On the daily chart, since 3 trading sessions not a single candle has given a close below prior day's low which is a positive sign. On 7th April, the stock has taken the support of middle Bollinger Bands® and now trading above upper bands®. Also, RSI is trading near 62 levels suggesting that there is enough room left on the upside for the stock to trend further.
In nutshell, trend for PATANJALI is bullish. A break above 1915 is must for positive momentum to continue with the targets 2040. On the downside nearest support is at 1840.
Trading strategy for intraday futures: Long positions can be created above 1915 with the stoploss of 1903 and target of 1927 followed by 1938 levels.
Trading strategy for positional futures: Long positions can be created above 1915 with the stoploss of 1895 and target of 1955. (One can book part profit near 1930-1935 and trail stoploss to cost).
Trading strategy for options: PATANJALI 1800 CE buy above 123 with stoploss of 110 and target of 148. (One can book part profit near 133-136 and trail stoploss to cost)
Patanjali 15 Min Chart: Happened as on 17th April 2025
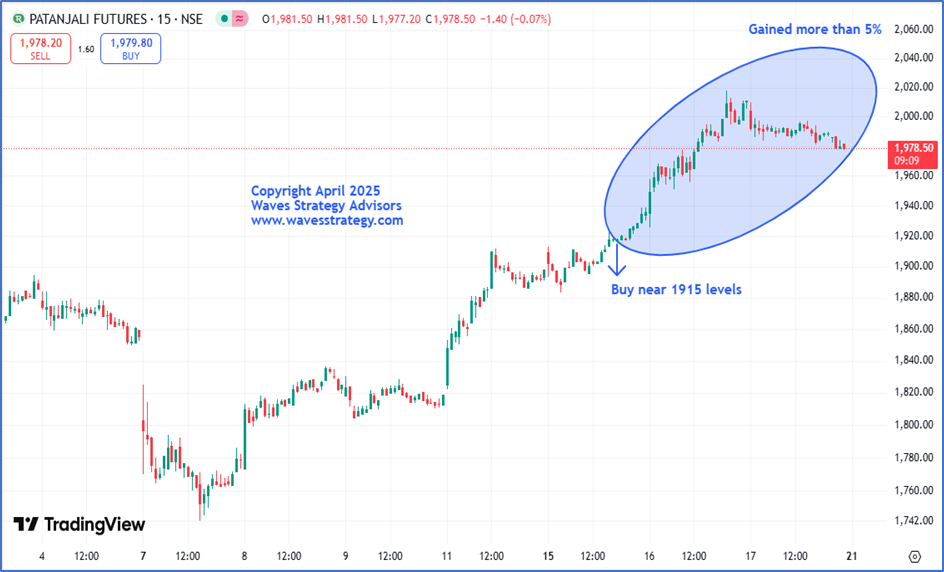
Happened as on 17th April 2025
After we published the report, Patanjali moved as expected and Bang On!! Stock moved by more than 5% and achieved our given targets in futures and options in just a matter of 2 trading sessions despite market fluctuation which is a strong bullish sign. Futures in just 2 trading sessions. Also, prices recently managed to break its rectangular range and recently made a fresh high of 2011 levels.
We successfully captured this entire up move with the help of simple price indicators like Bollinger Bands. One needs to combine it with price action for more accurate results!
Brahmastra (Mentorship) on Timing the market – Learn the complete science of Trading using technical analysis, risk money management, time trading techniques, complete handholding, and lifelong association in an upcoming mentorship program with the live trading session, Fill below form for more details