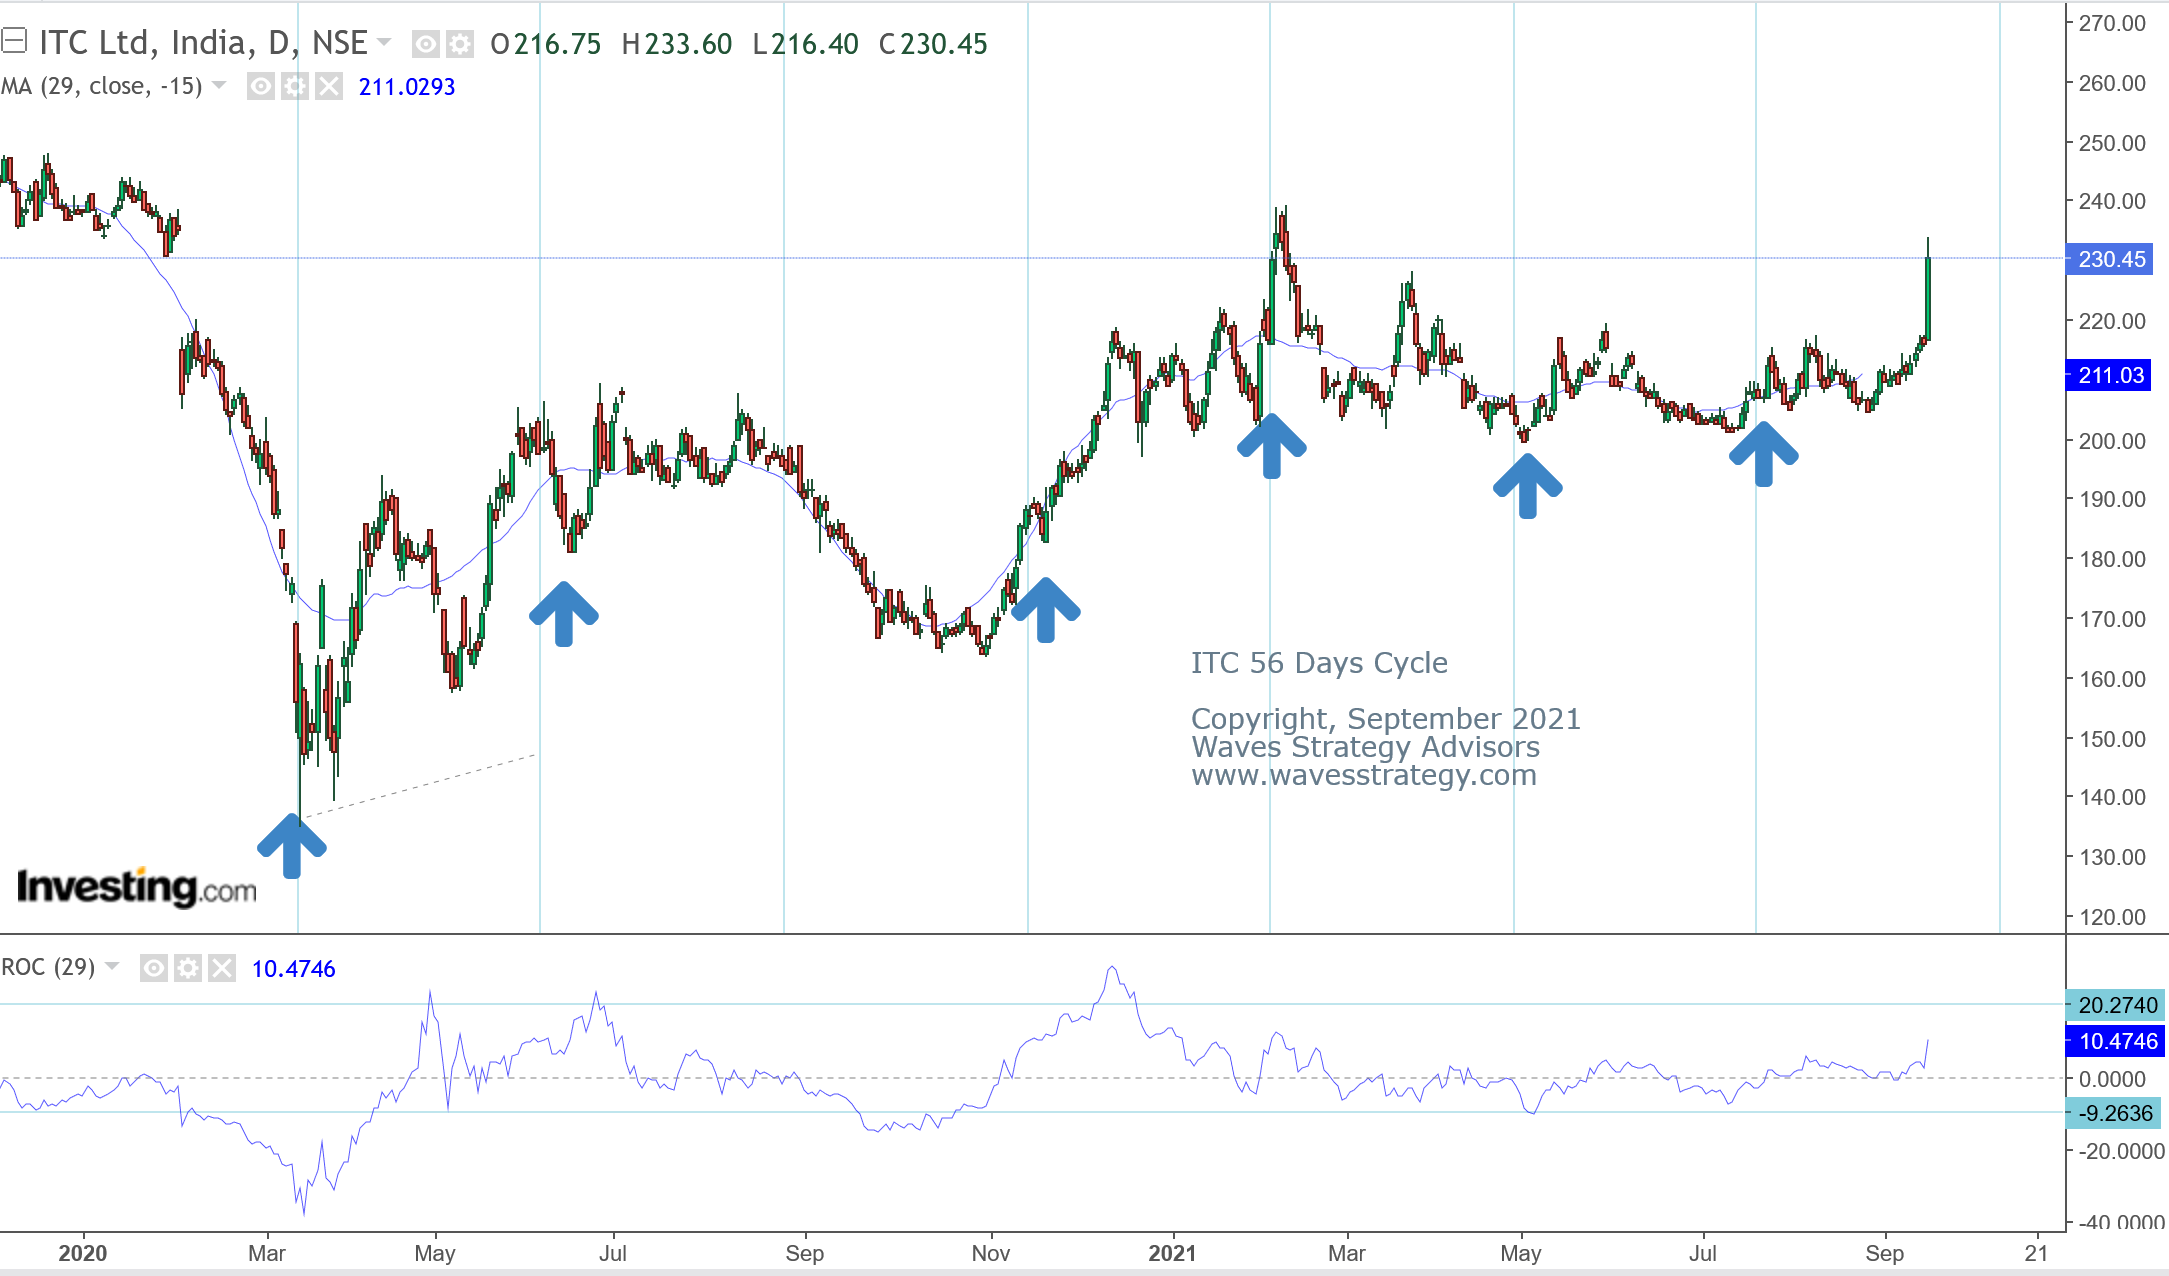
ITC 56 Days Time Cycles working like magic
Sep 16, 2021
Like this Article? Share it with your friends!
ITC breakout with huge volumes today but closed above upper BollingerBands 2 days back itself. BB breakout strategy working out awesome. Keep riding this stock using simple trend following method.
ITC 56 Days Time Cycles giving much earlier signals and working like magic. See the chart Be a part of this thrilling experience,
See ITC 56 Days Time Cycles Chart:

Imagine how you can pursue your passion with the time at your hand when you do not have to see the market throughout the day but just form a strategy and let it run. know more about Master of Cycles over here
ITC chart discussed today with tgts during live trading session Mentorship on Technical Analysis, BankNifty also going amazing went long by selling puts when it was at 36150, up by 500 from there, Enjoyed addressing Mentees on the scientific way of trading.

Join Mentorship on Timing the Markets for the FIRST TIME EVER starts November 2021 –In this Mentorship program, all the necessary tools are given right from stock selection methods, strategy, follow-up action to derive a complete trade setup in step by step fashion. To know more check here
