3 powerful indicators on Nifty (That actually work)
Jul 02, 2020Understanding and capitalizing the trend with the help of important techniques like Elliottwave, Ichimoku and Bollinger!
Nifty has shown consolidating moves before the up move. But if you combine even 3important methods like Bollinger band Channels and Ichimoku Cloud you canprobably make a killing in the movement. The up move in Nifty could have been capturedusing these simple trading systems
See how one can trade Nifty using Ichimoku Cloud, Band, Wave counts.
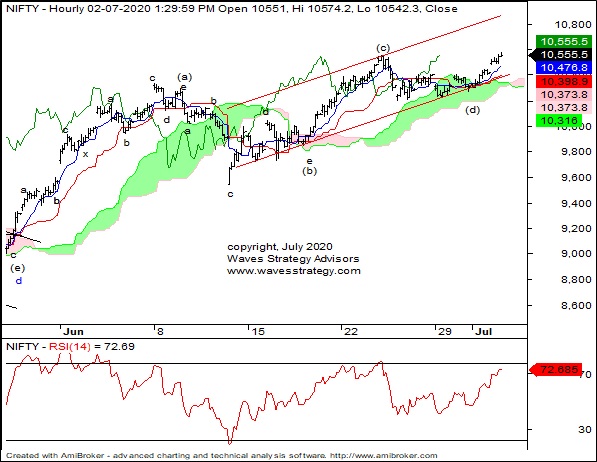
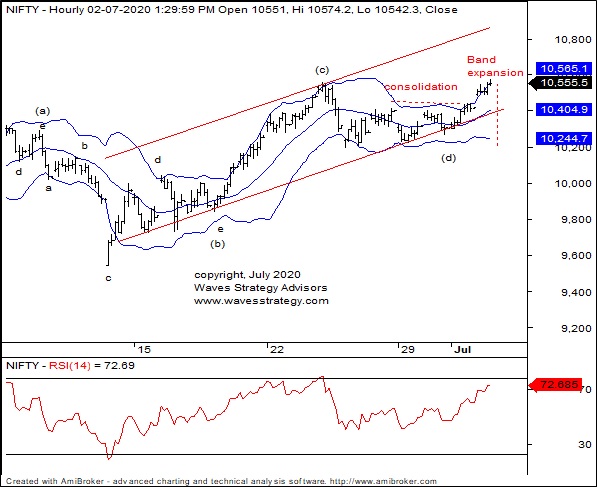
See yourself below chart of Nifty on 60 mins scale with Ichimoku cloud, Bollinger and channels.
Nifty 60 minutes chart with Ichimoku:
Nifty 60 minutes chart with Bollinger Bands:
Following are the 3 powerful indicators. This might look common but if enough attention is paid it will provide important information that will help in increasing the trading accuracy.
Ichimoku Cloud: On the hourly chart post making a swing high near 10553 levels (on 24thJune, near channel resistance) price dipped in the Ichimoku cloud and in the previous session bounced above it, which is a classic buy setup. Allowing base, conversion and lagging lines in sync i.e prices are placed above these lines giving a long trade setup.
Bollinger Band: Post witnessing consolidation of 3-4 days which is also seen on bands where band have squeezed. Recently we have seen the break out and band expansion. What made expansion into is that, prices were trading between middle and upper band which gave positive confirmation.
Elliott- Neo Wave pattern: We can see wave (d) has been terminated near the channel support which played an important from where the prices bounced off. Currently price can be seen moving in the form of wave (e).
You can see how these methods are simple but very effective for trading. The trading strategies are also given in the daily morning research report with clear targets and stoploss.
Get access to the research reports and call tips directly on whatsapp with clearly defined stoploss and targets along with detailed charts
Get clear Trade Setups in the upcoming ONLINE training scheduled on 25th &26th July 2020 in Master of Technical analysis (MOTA). Also learn about Neo wave, Elliott wave, Time cycles scheduled on 22nd- 23rd August 2020 (MOW). You do not necessarily require prior knowledge of technical analysis and we will ensure you get it right from the very basic to most advanced level. Dedicated discussion groups will be created to keep the learning going in future. Know more here
